/W/
Regional MPAS -- Dr. Stephen Masters, Consulting, LLC
Dr. Stephen Masters Consulting, LLC
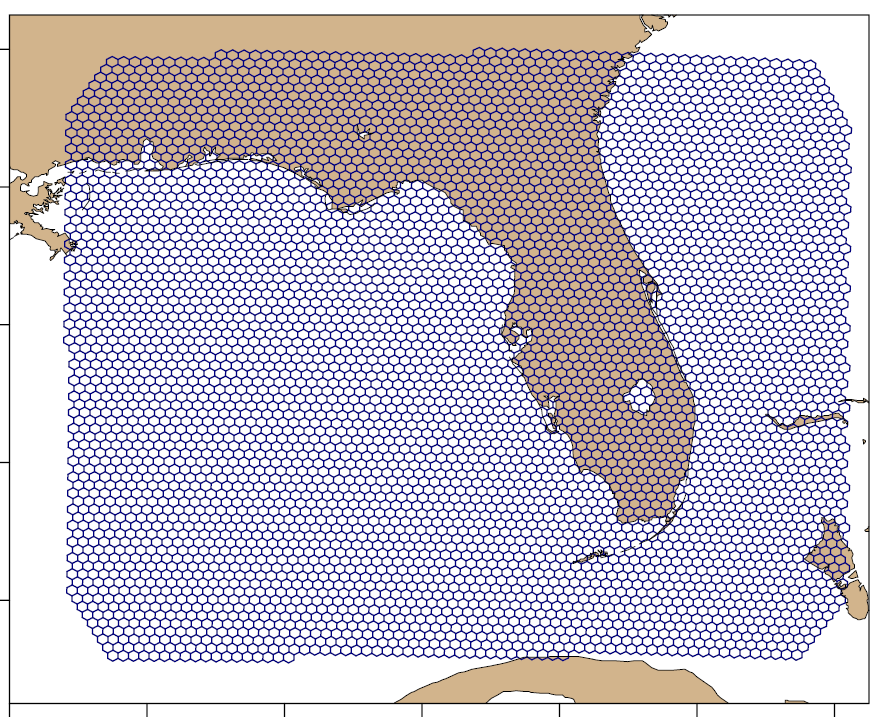
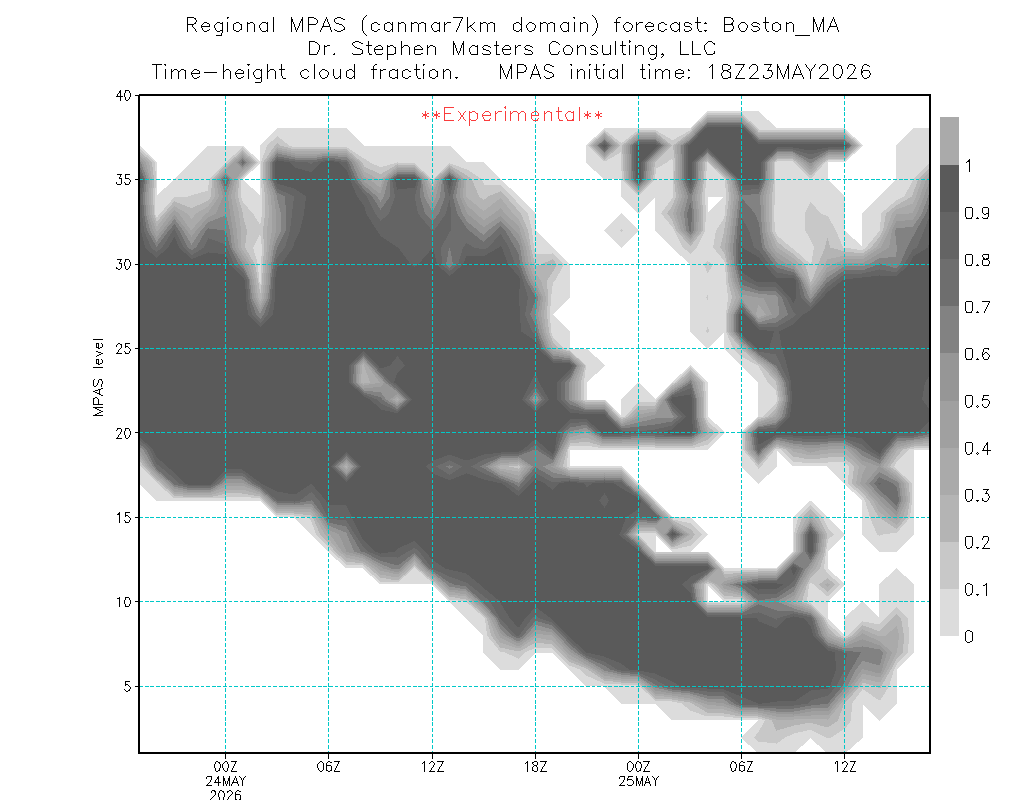
Regional MPAS--Model for Prediction Across Scales
Dr. Stephen Masters Consulting is now running regional MPAS domains in
addition to two global forecasts run each day.
MPAS (Model for Prediction Across Scales)
was developed by and is supported by the National Center for Atmospheric Research.
I am currently transitioning to Version 8.3.0 (June 2025)
and am running on a 32-core Intel-i9 Linux system. These regional domains
are initialized from the United States NCEP Global Forecast System (GFS).
2026-06-21_18 job completed at Sun Jun 21 10:27:25 PM EDT 2026
The plots and data you see here are produced by
Dr. Stephen Masters Consulting, LLC
and are freely available. We ask that you give credit to us if you use these data.
We can create custom plots from the MPAS or NCEP models or data.
Contact Steve for more information.
Disclaimer: These charts are provided "as-is" with no guarantee
of availability. Always check the dates on the charts to make sure you
are viewing the latest available data. Please do not use these for commercial
purposes without permission of the author.

