
|
Dr. Stephen Masters Consulting, LLC
|
NCEP Data and SMC Modeling Plots
The plots and data you see here are produced by
Dr. Stephen Masters Consulting, LLC
and are freely available. We ask that you give credit to us if you use these data.
We can create custom plots from the NCEP models or data and configure WRF or MPAS simulations
to fit your requirements. You may be surprised at the relatively modest computer
resources that are required to run your own numerical weather prediction simulations.
Contact Dr. Masters for more information.
Credits: NCEP GFS, and HRRR data are from the
National Center for Envoromental Prediction.
Raw GOES-16 imagry and Geostationary Lightning Mapper (GLM) data also from NOAA.
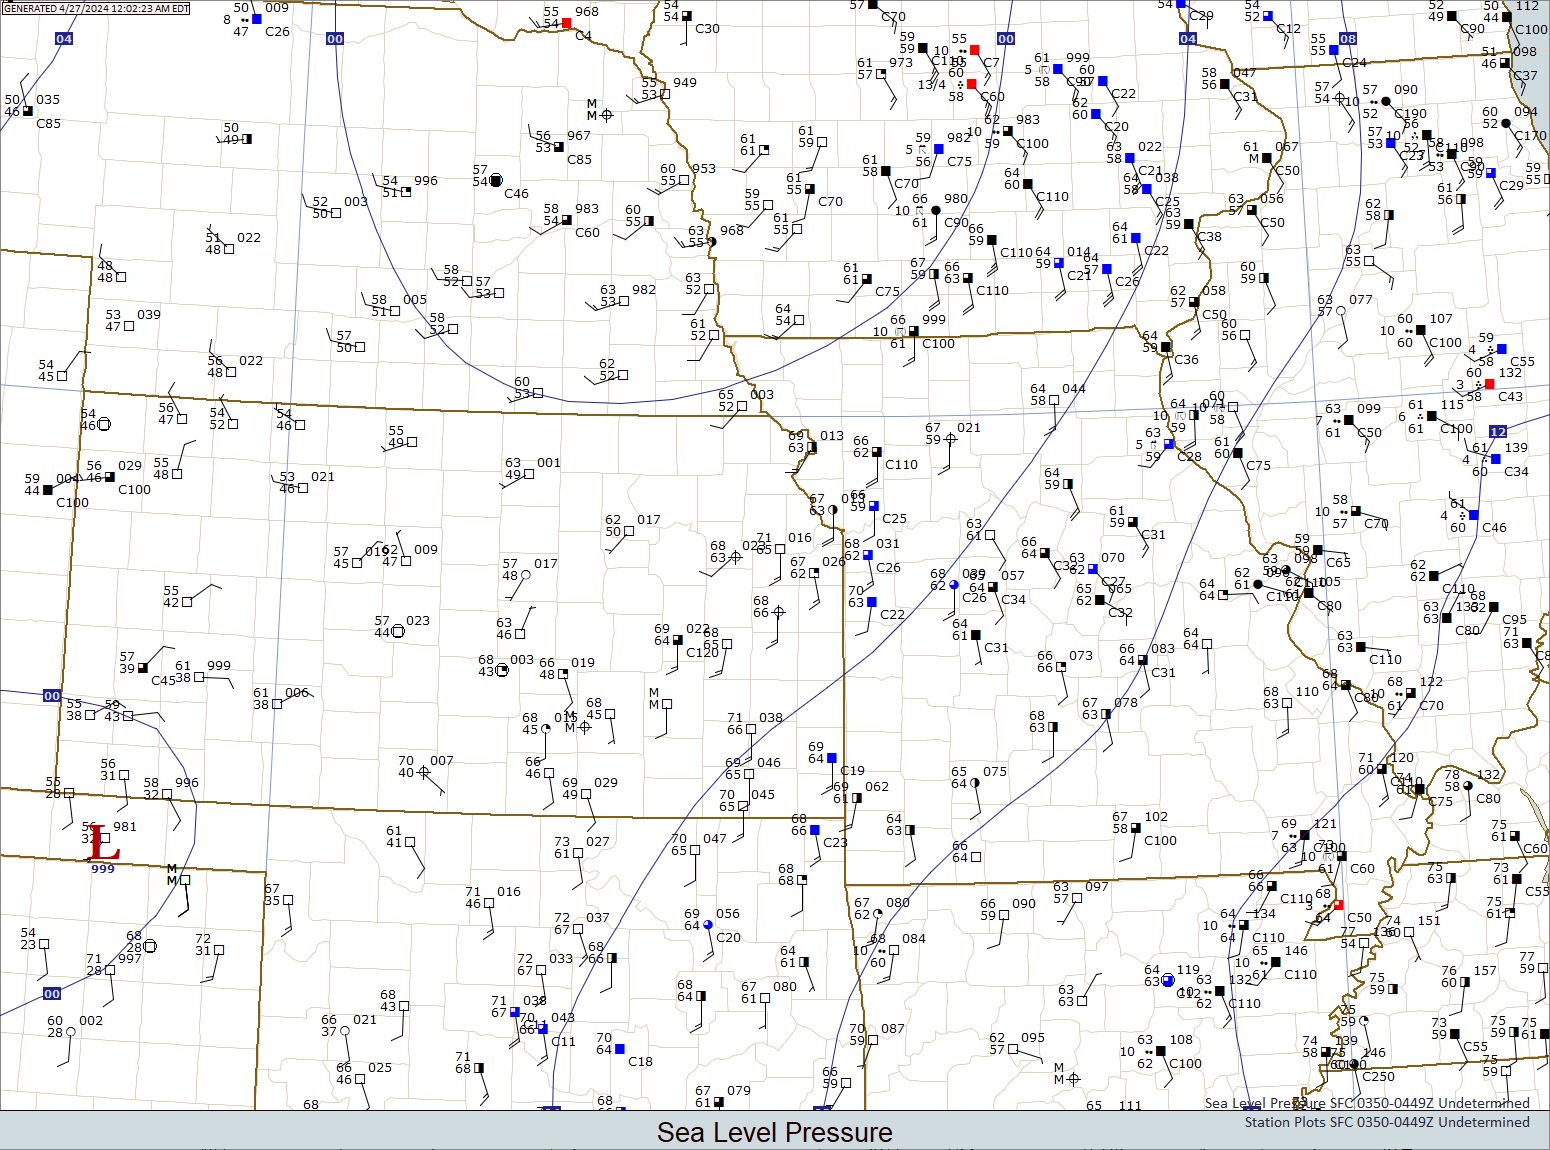
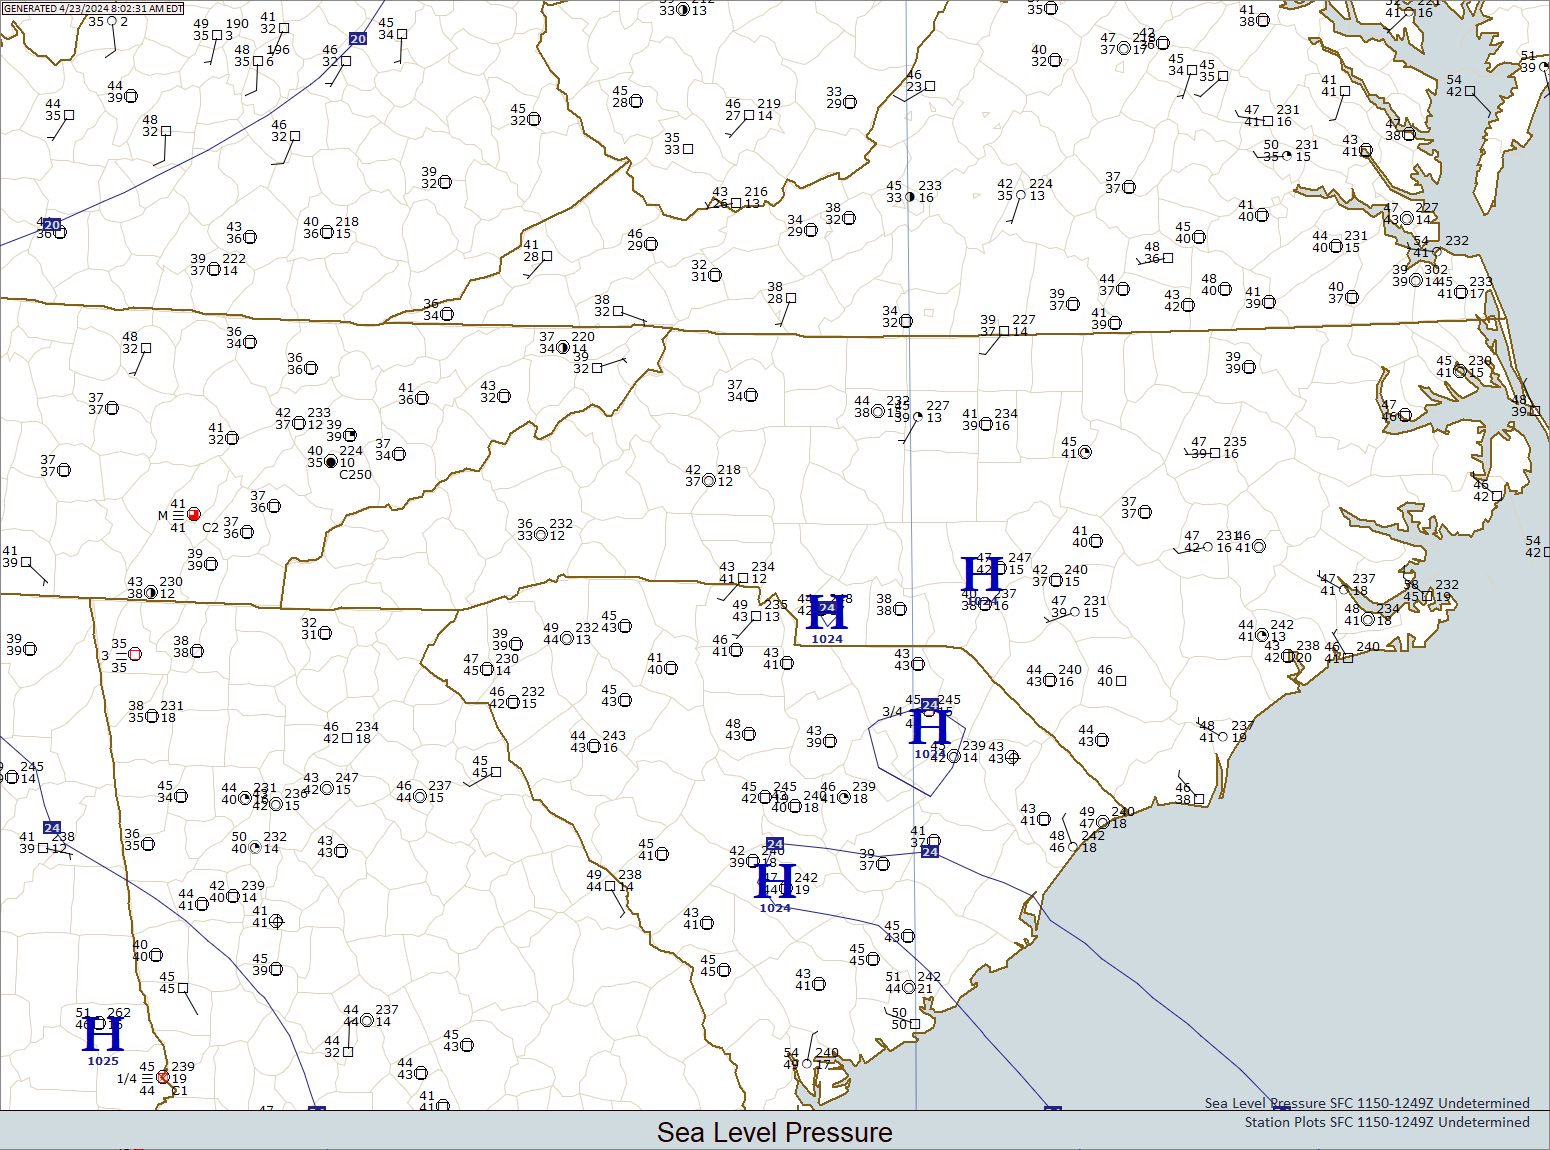
The surface maps are created with Digital Atmosphere from
Weather Graphics Technologies.
The MPAS and WRF simulations are configured and run on local servers by Dr. Stephen Masters Consulting, LLC.
Disclaimer: These charts are provided "as-is" with no guarantee
of availability or suitability for your purpose. Always check the dates on the charts to make sure you
are viewing the latest available data. Please do not use these for commercial
purposes without permission of Dr. Stephen Masters Consulting, LLC.
What's new?
- May 1, 2026: Several sets of new images from
my Celestron Origin have been
posted. Included are my first attempts at post-processing using the Siril program.
- May 1, 2026: The Australia and New Zealand WRF and MPAS jobs
have been replaced with jobs covering the Canadian Maritimes. Lightning maps and GOES images over the
Maritimes have also been added.
- May 1, 2026: The
background radiation data
have been "cleaned up" after a data outage caused some of the data and statistics
to be corrupted.
Quick links
Weather at home
--
graphical
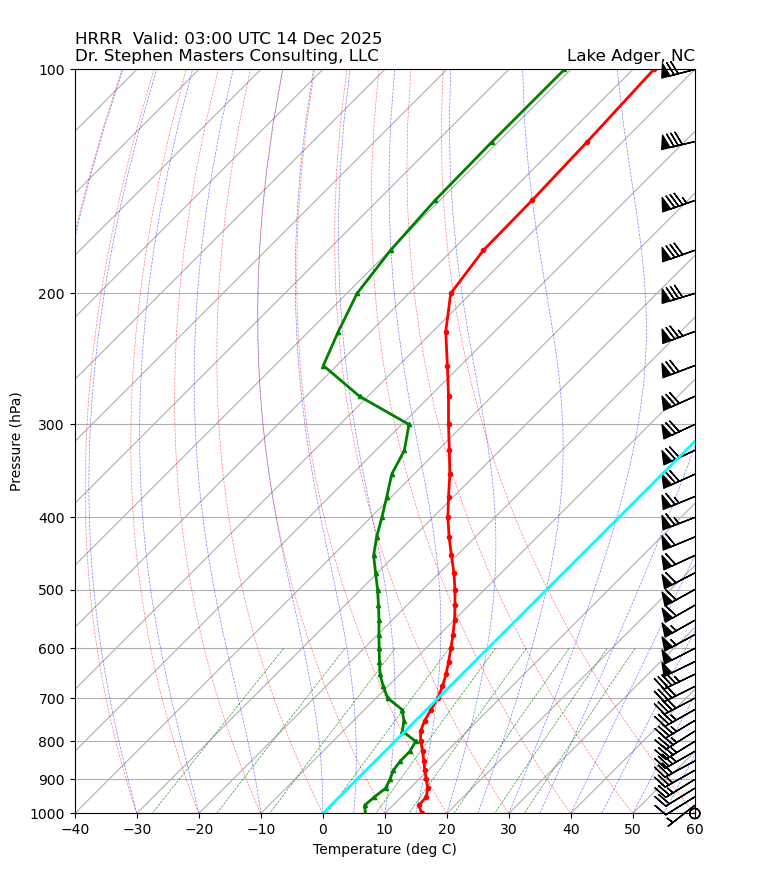
Lake Adger, NC
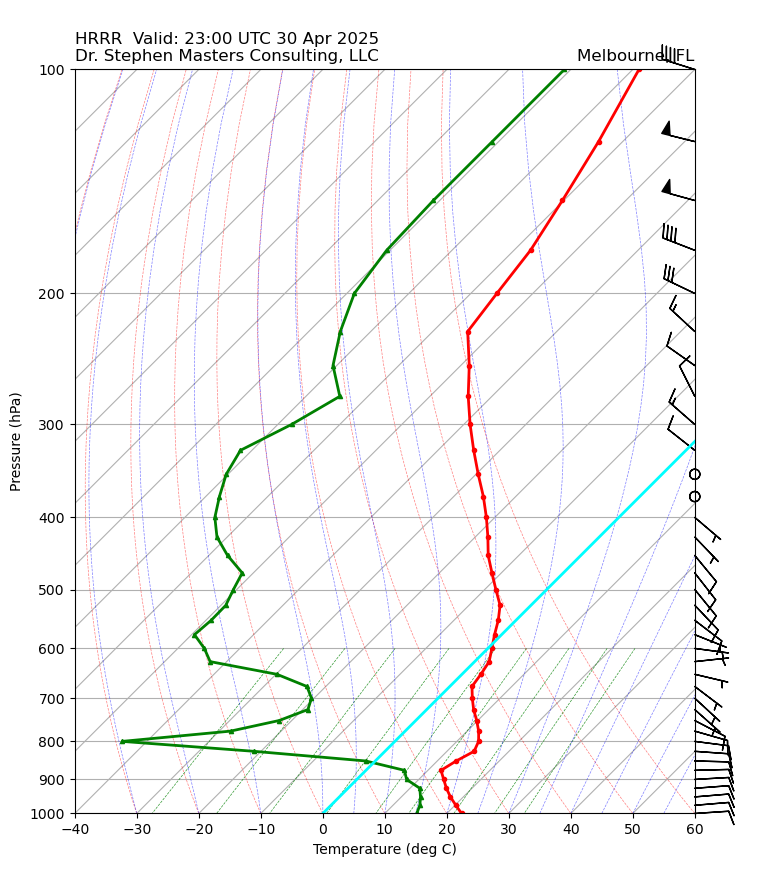
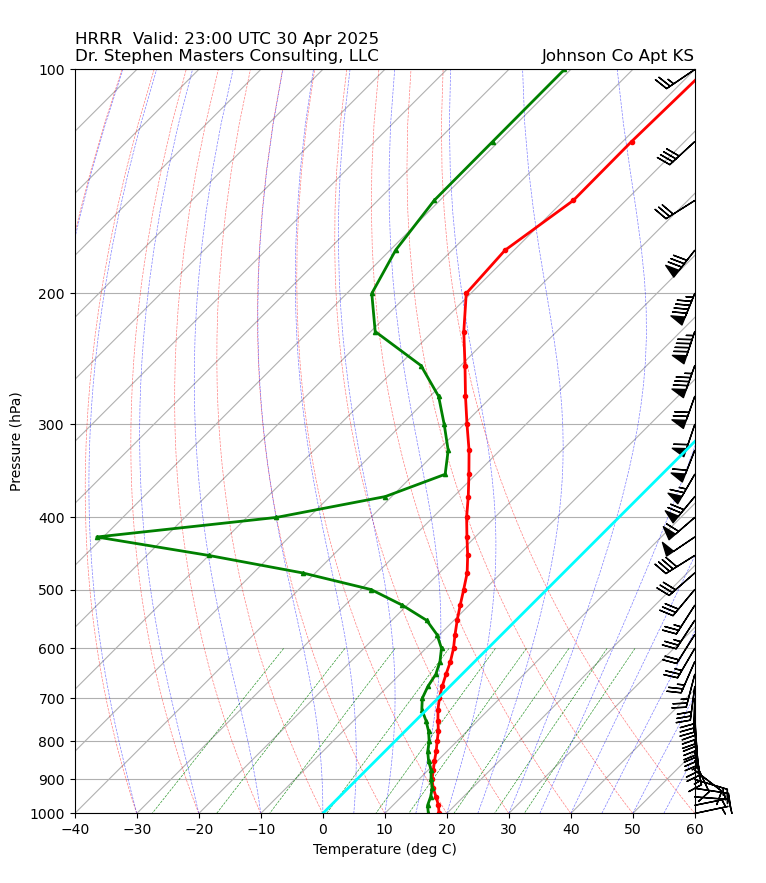
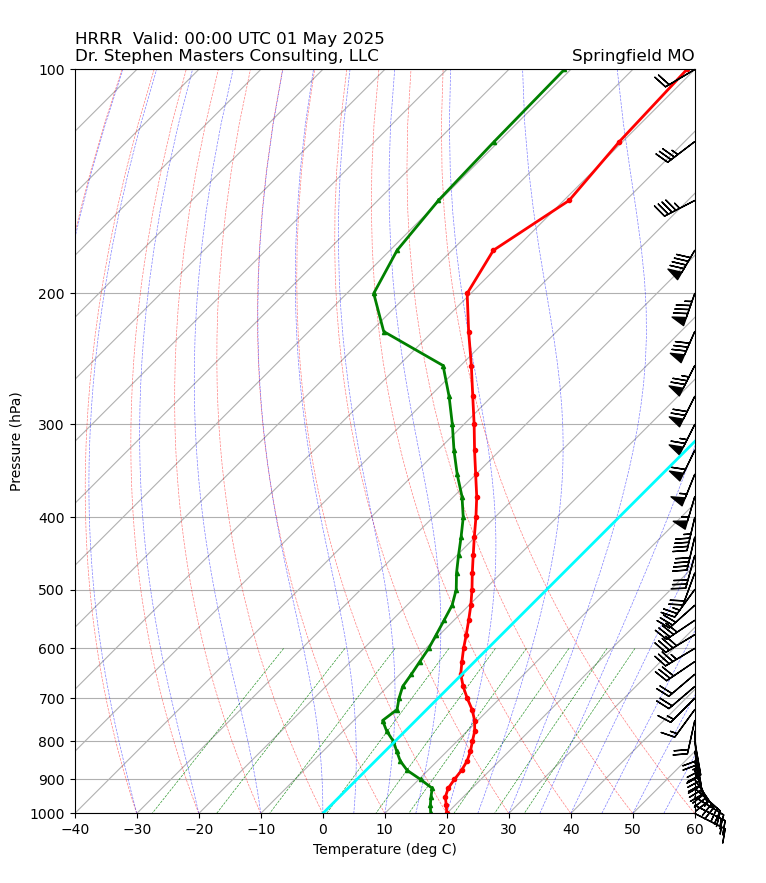
HRRR sounding
Weather station
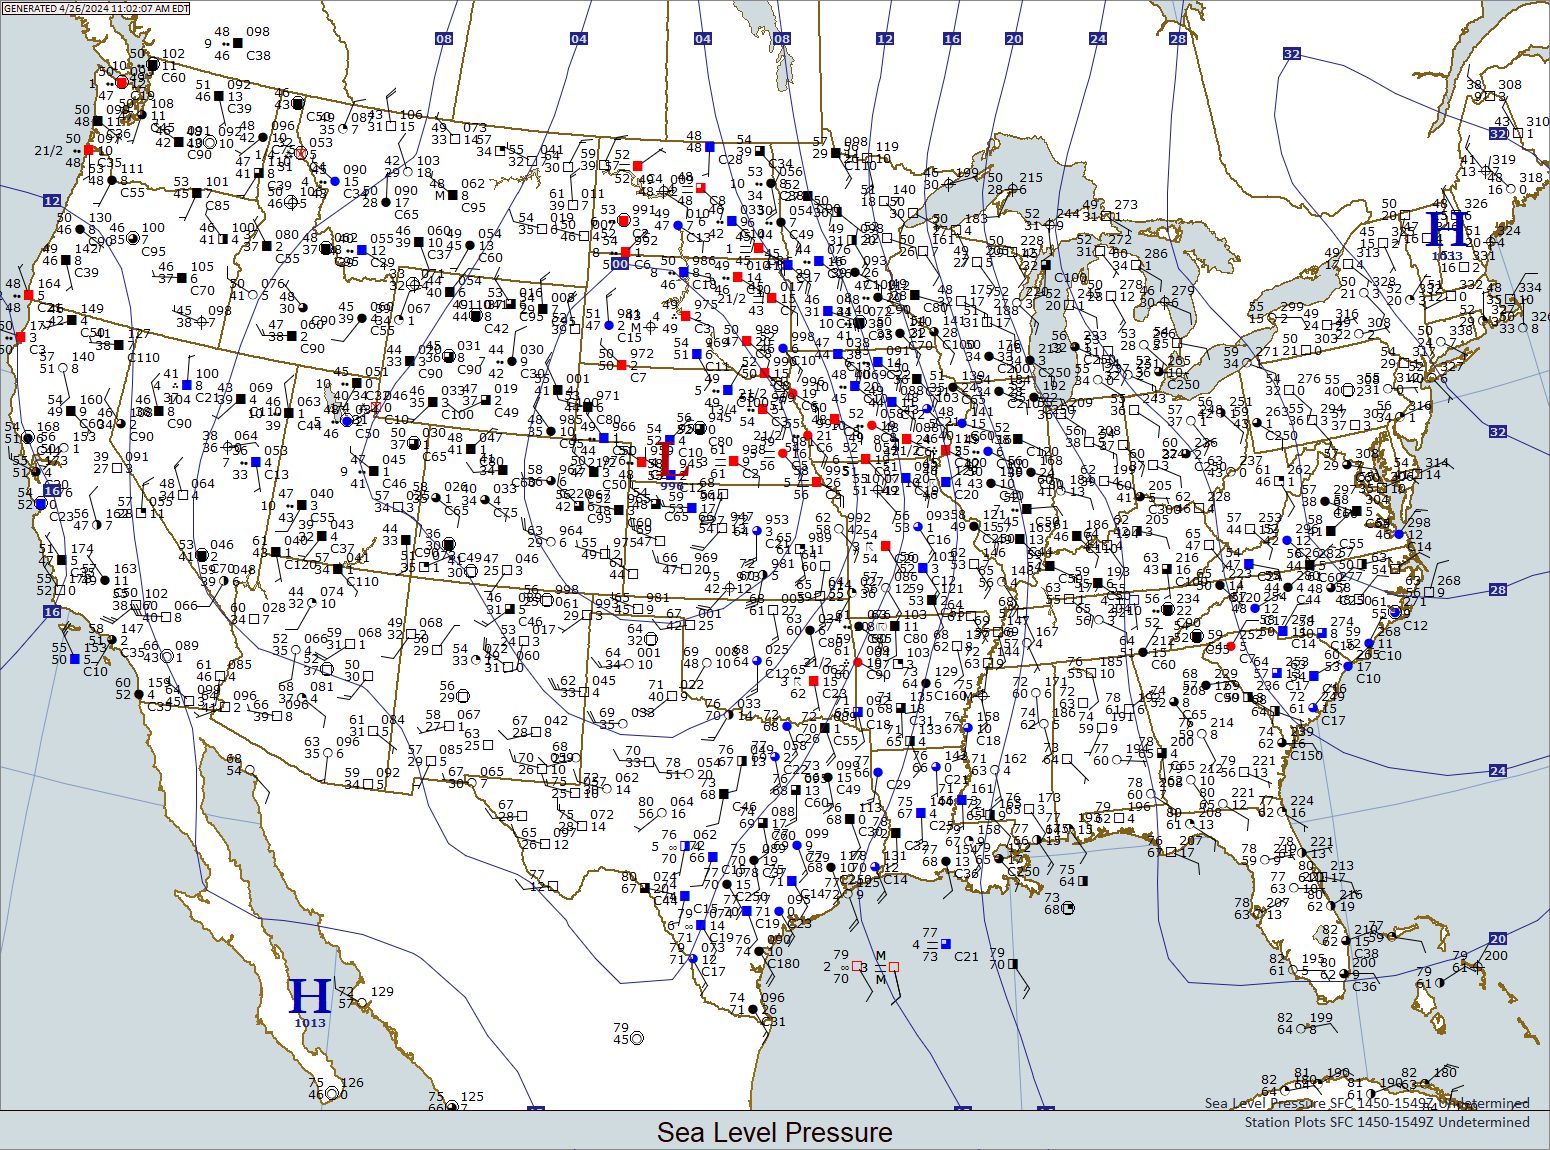
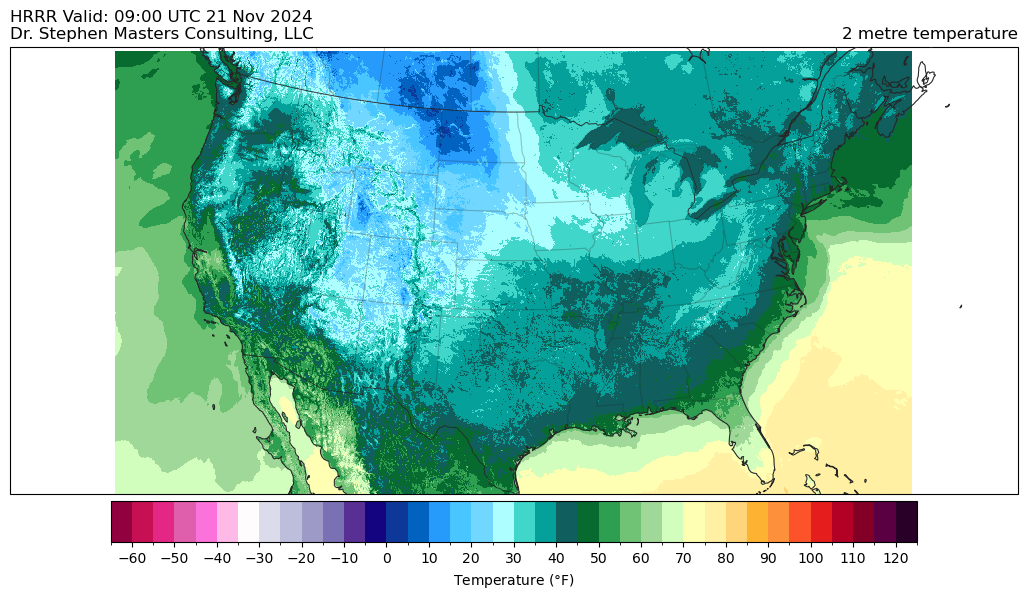
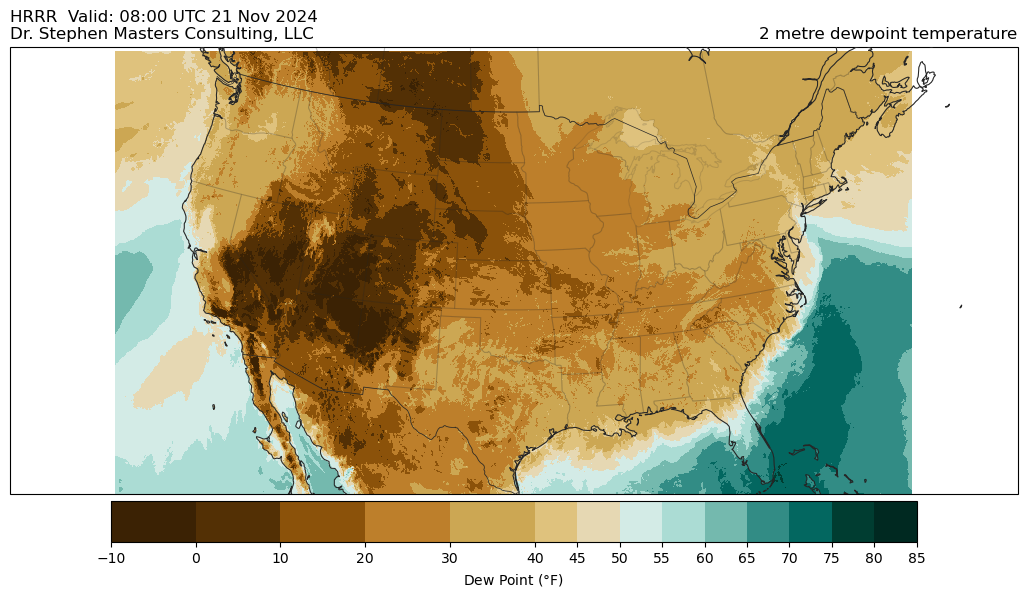
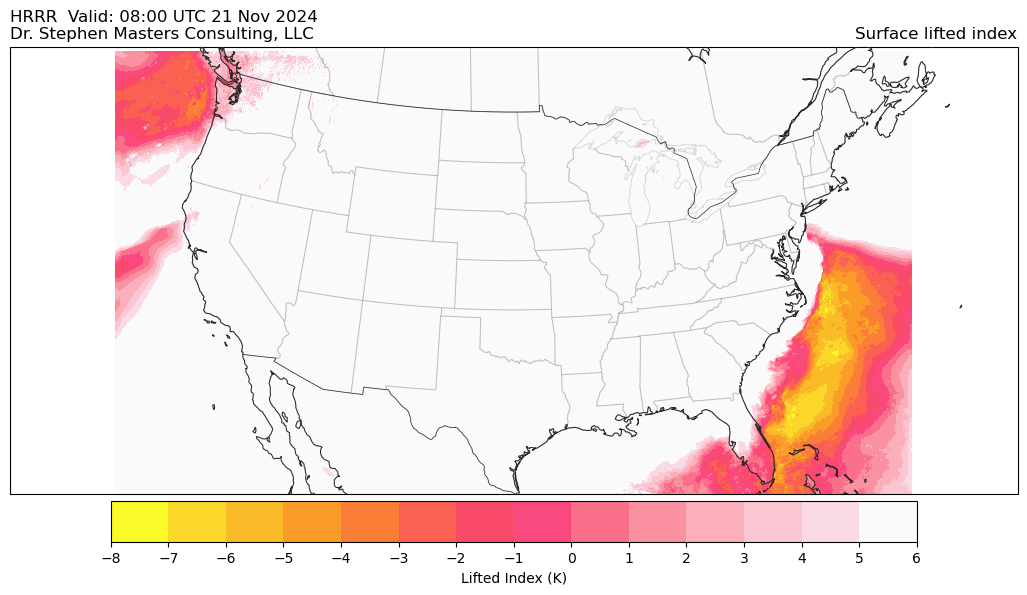
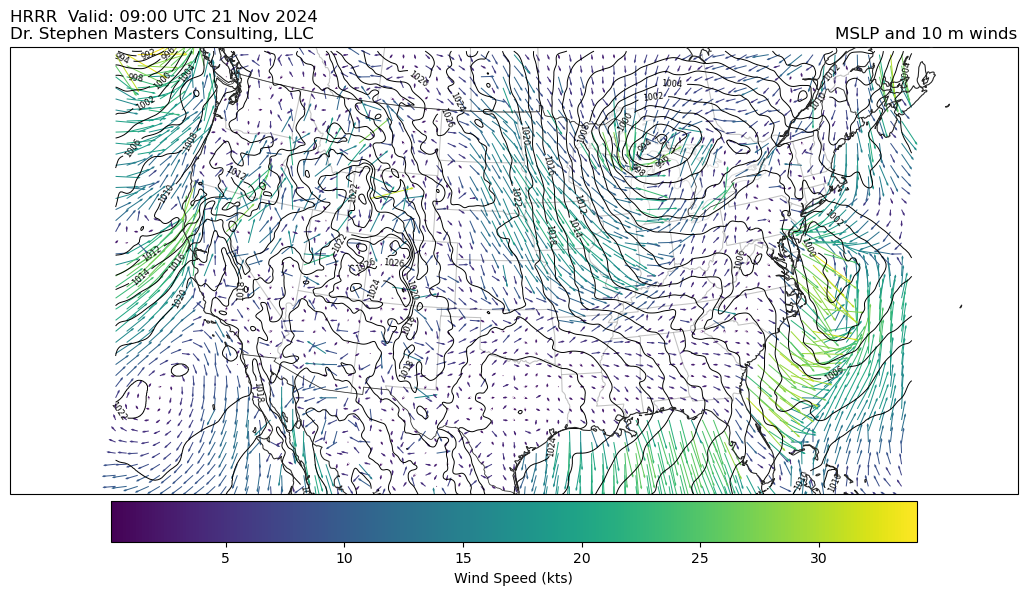
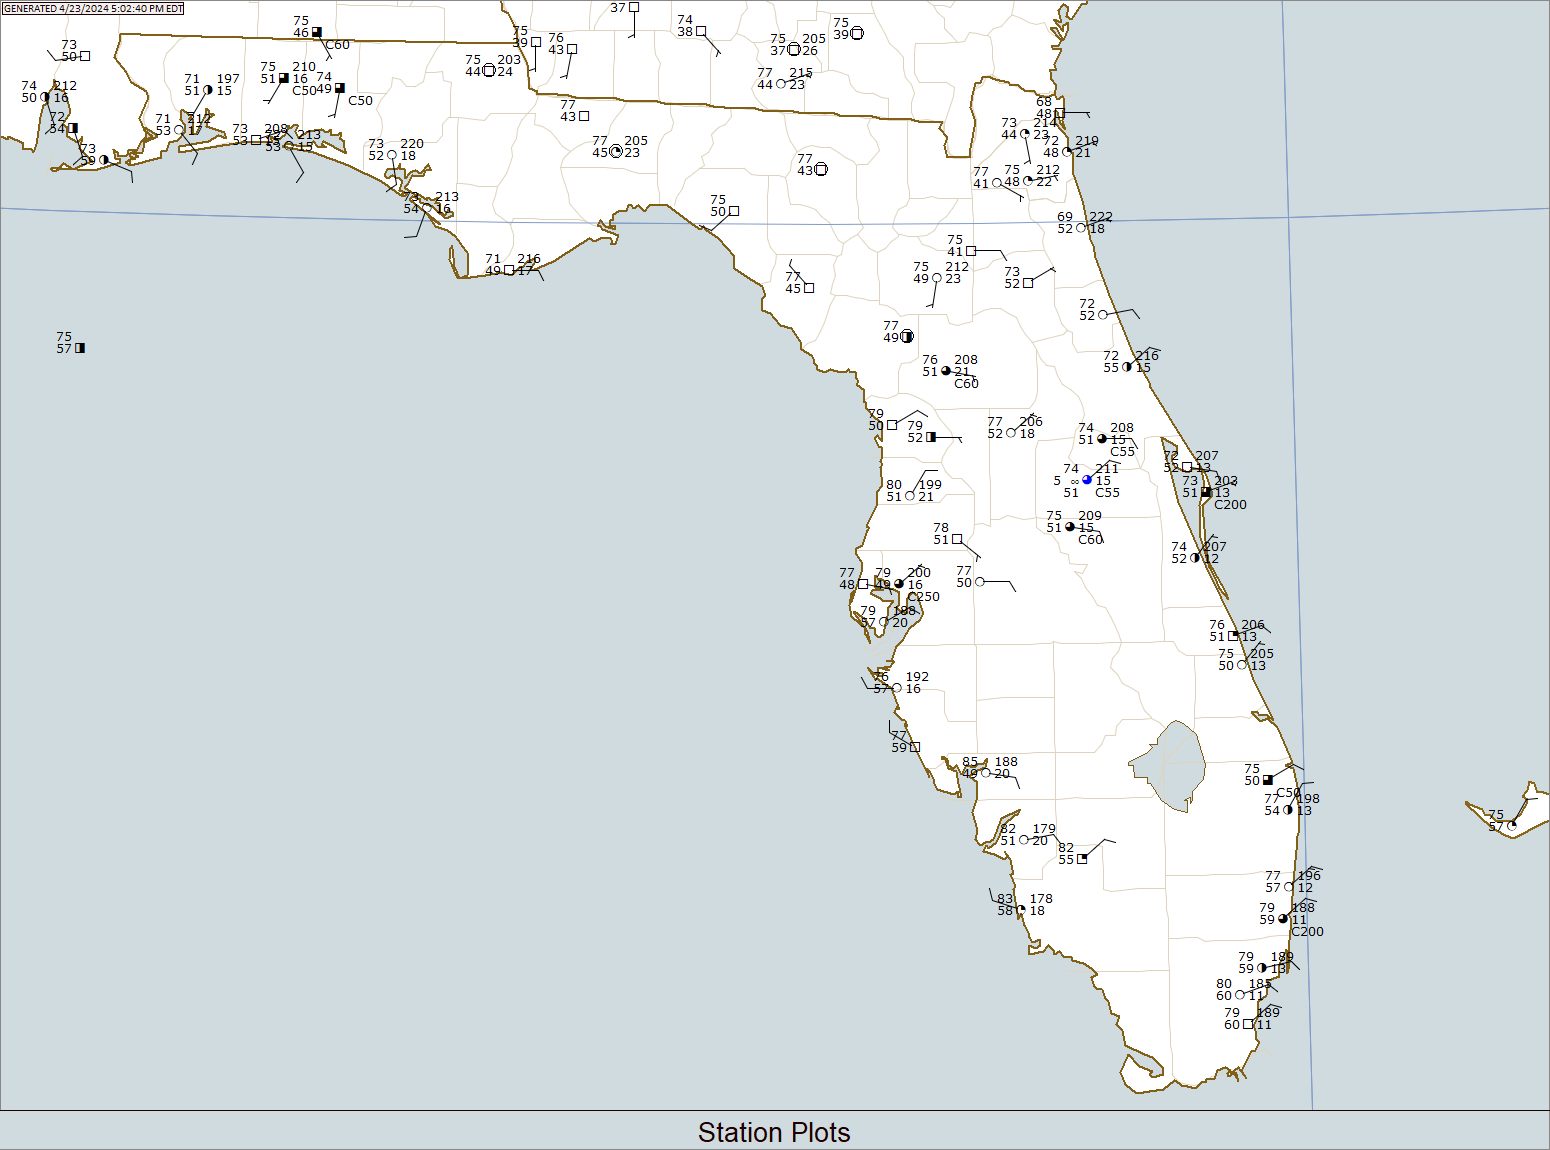
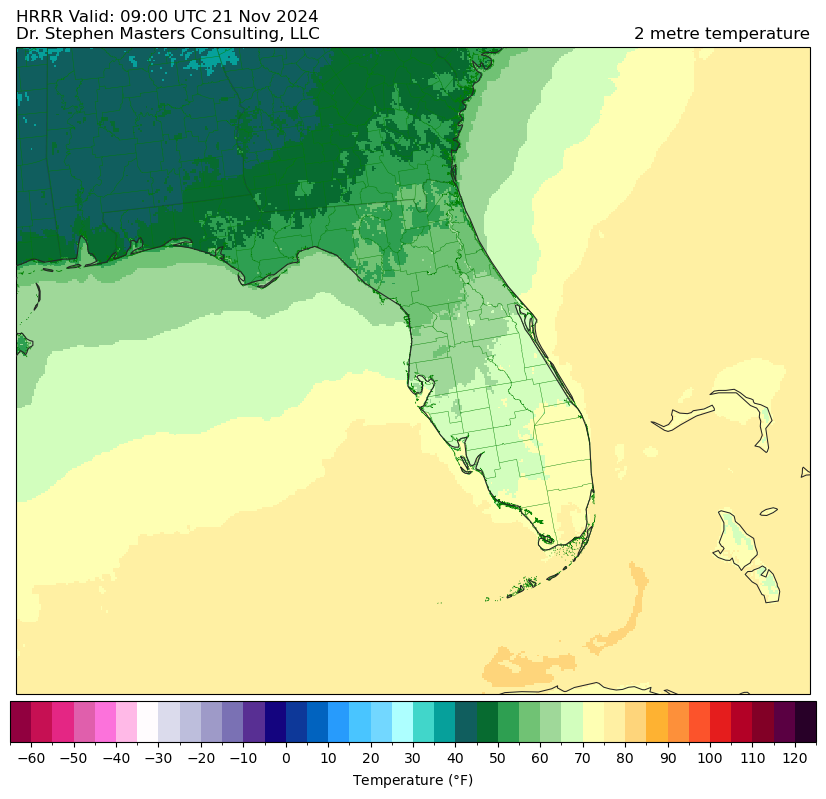
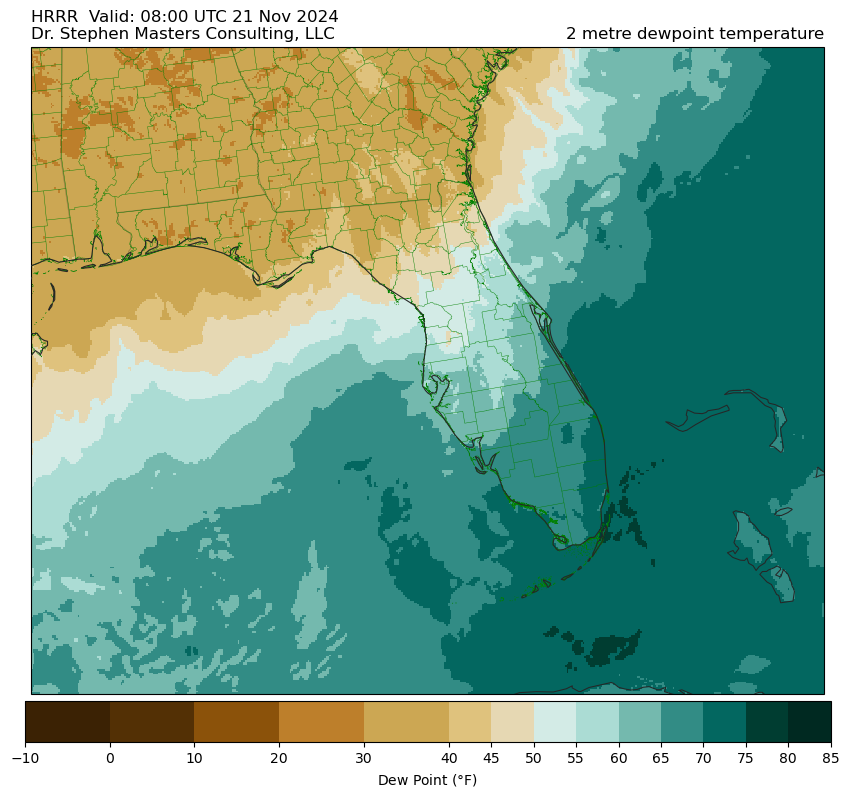
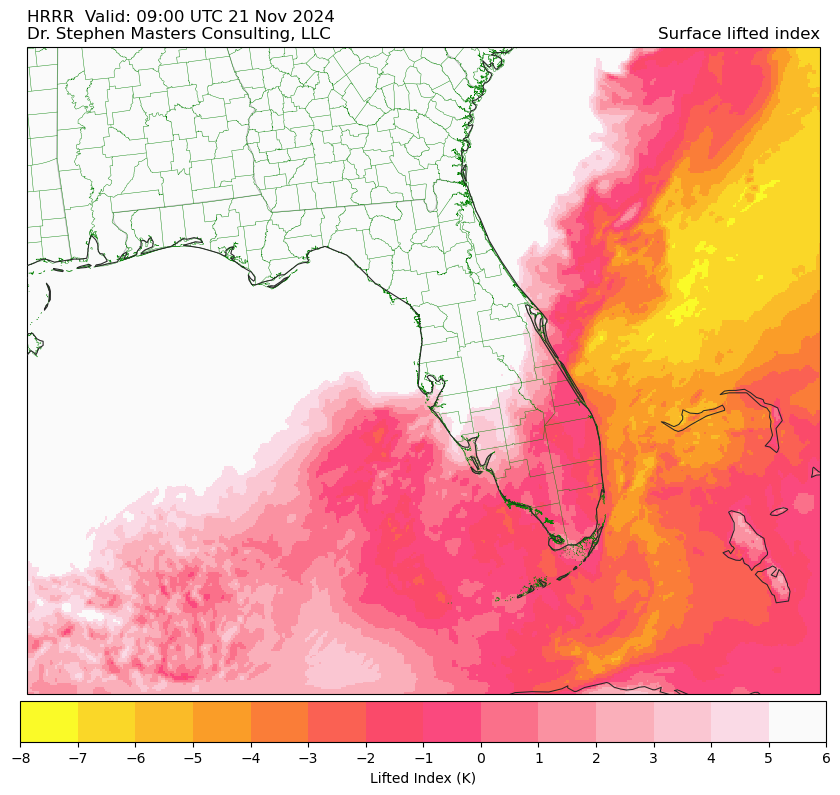
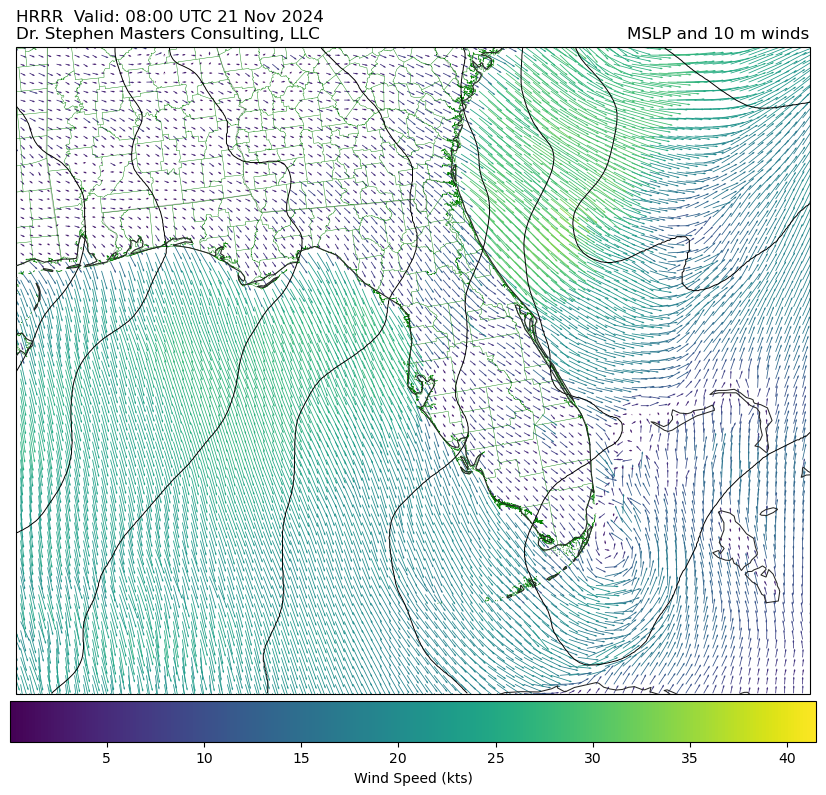
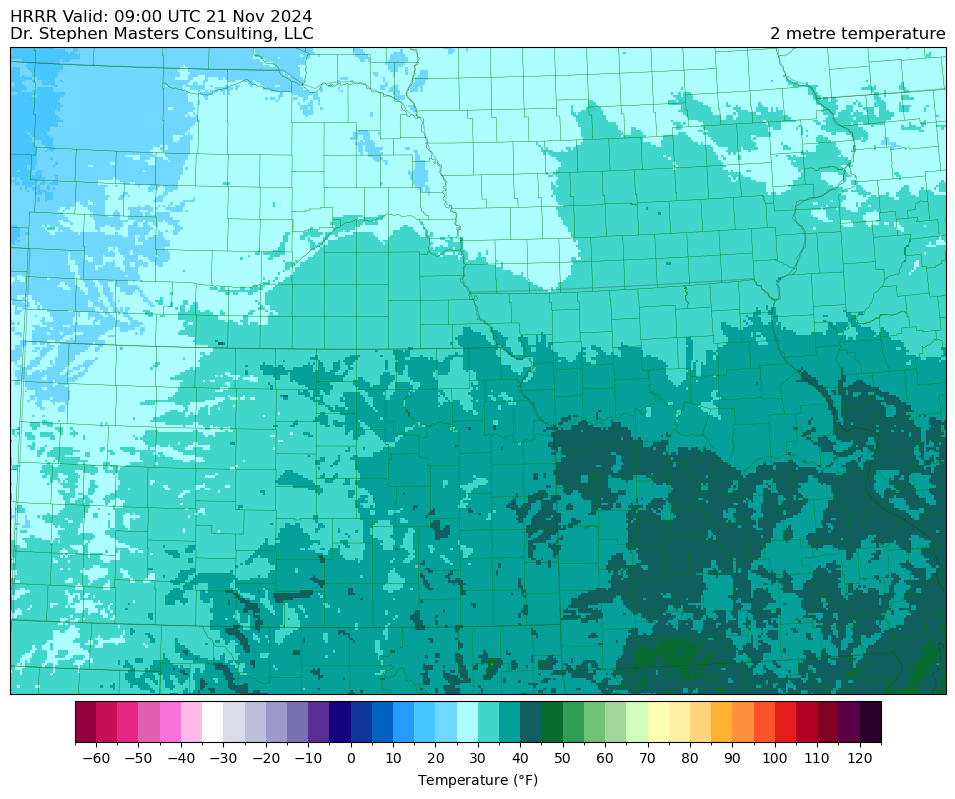
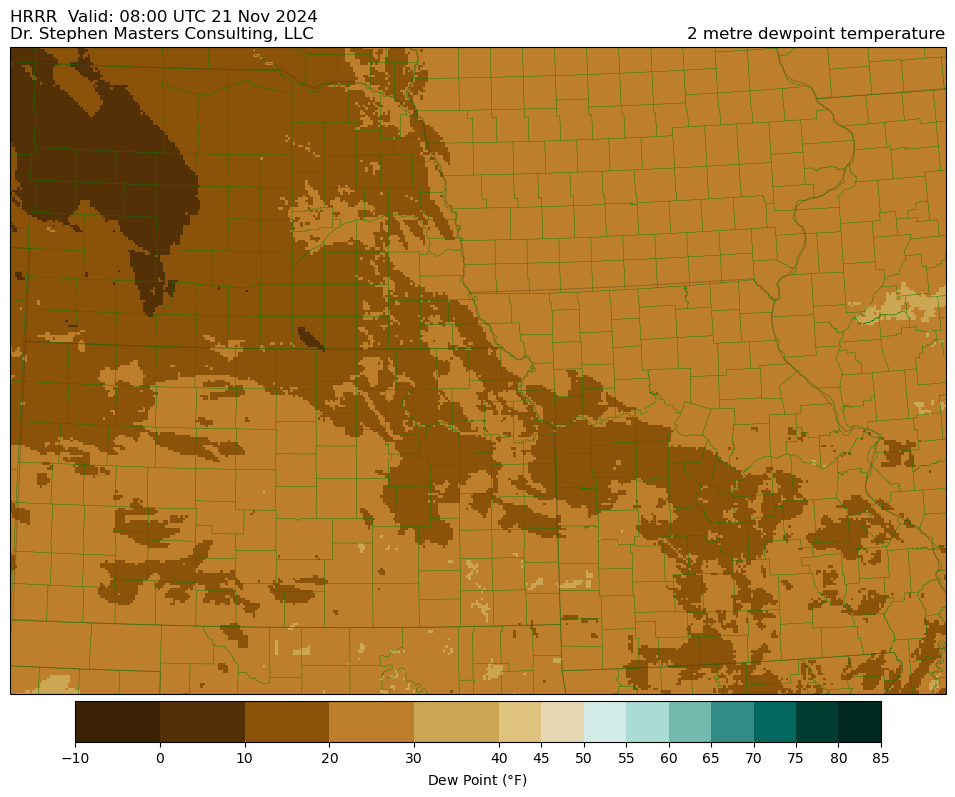
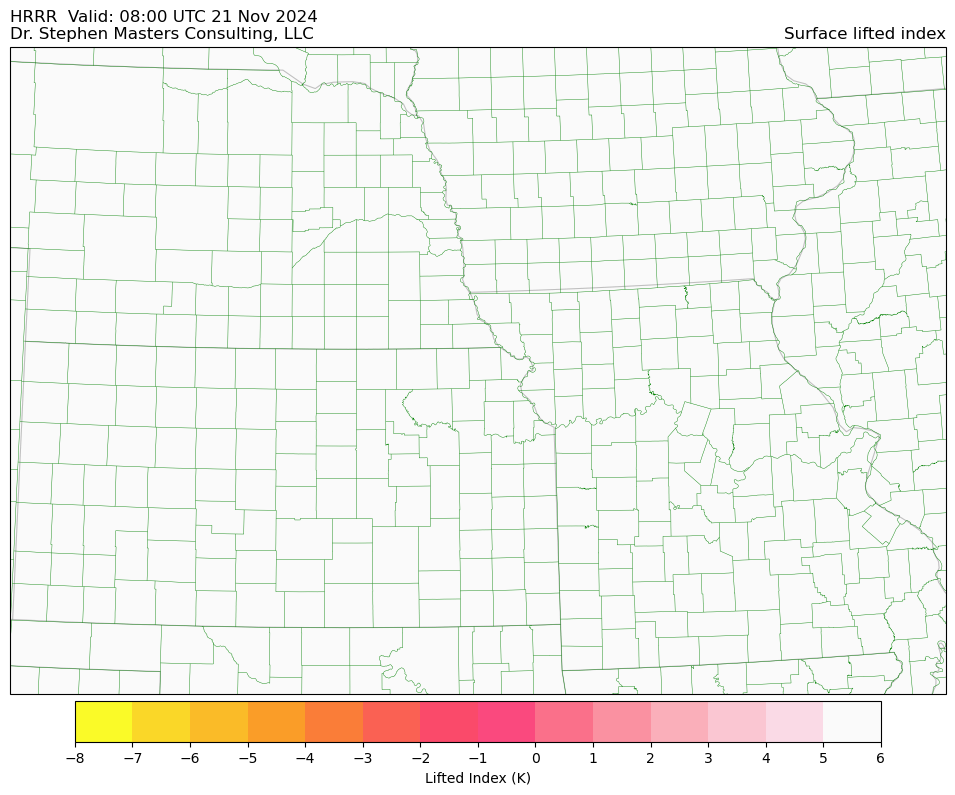
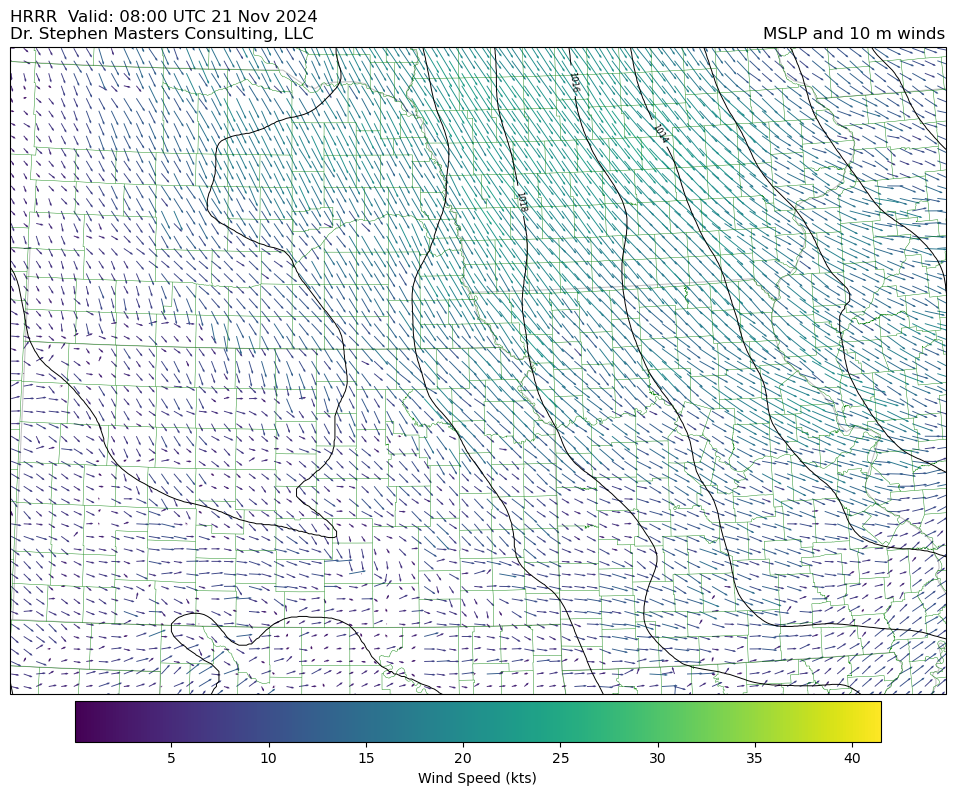
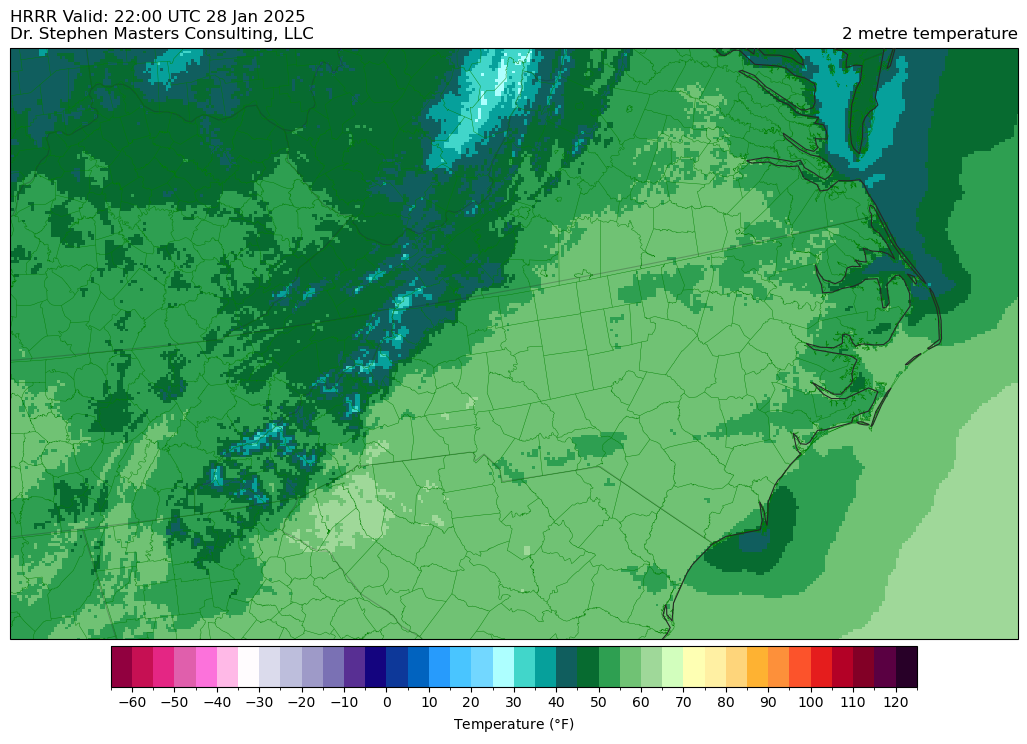
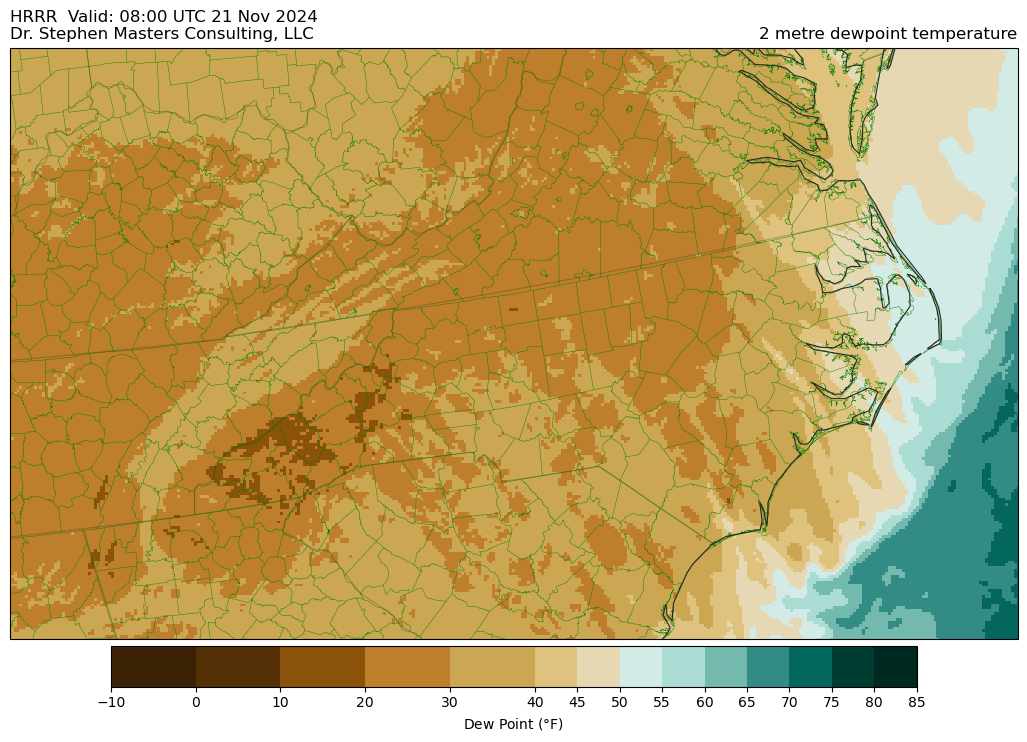
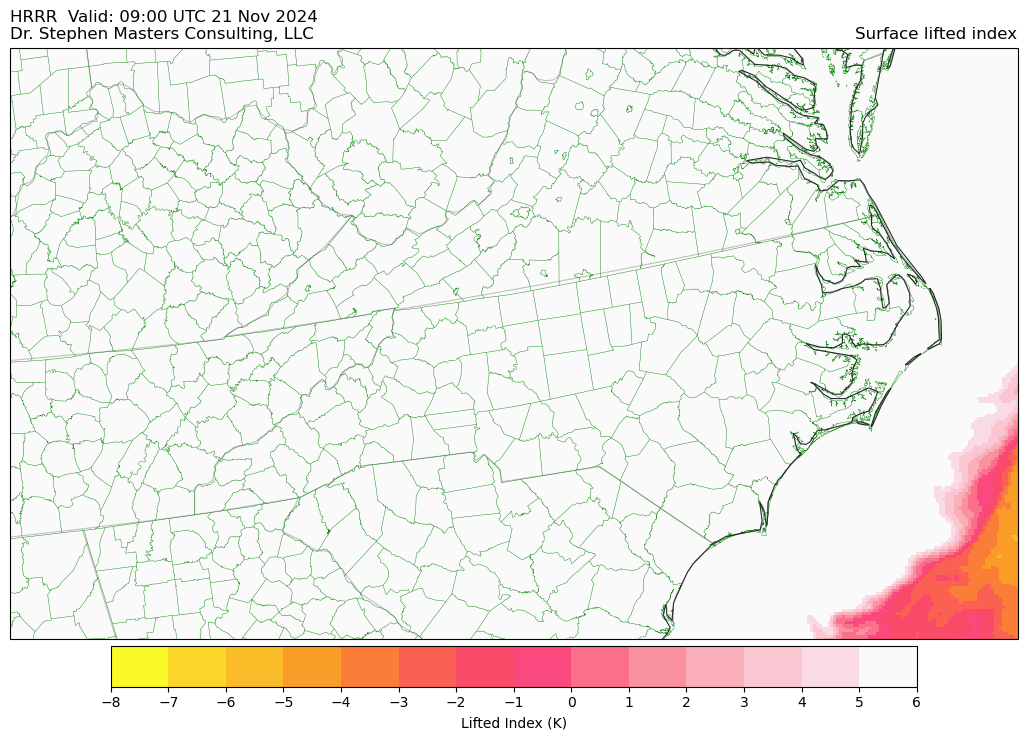
Current Observed Condtions and HRRR Analyses
The observations map is updated at :05; the HRRR analyses are updated at :07 from the analysis
one hour before. The lightning and satellite data are updated several times each hour.
Always check the date and time of the plots carefully. You may need
to "reload" the image in your browser to get the most current picture.
Global Weather
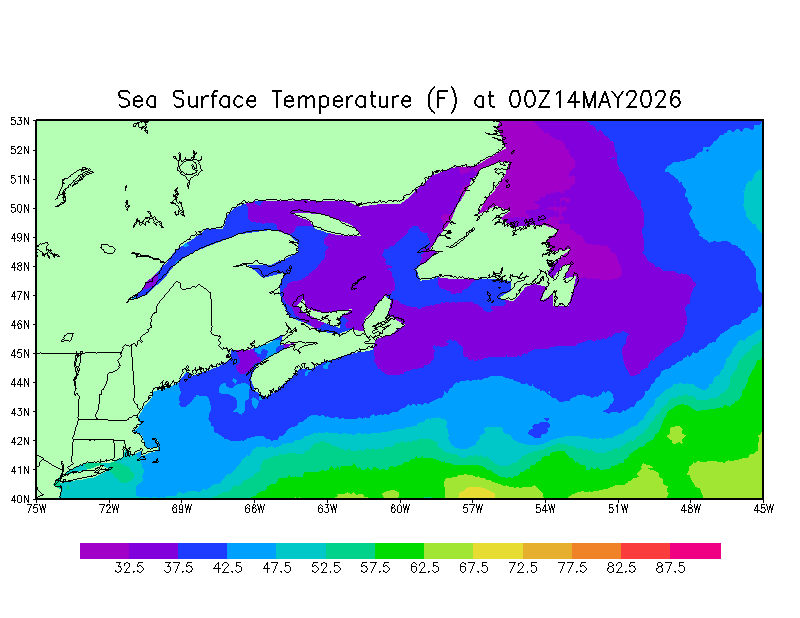
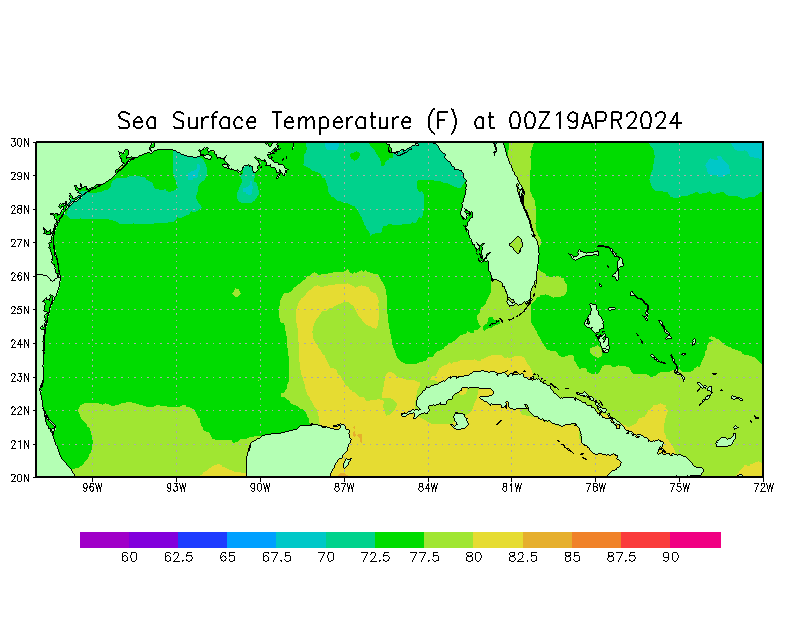
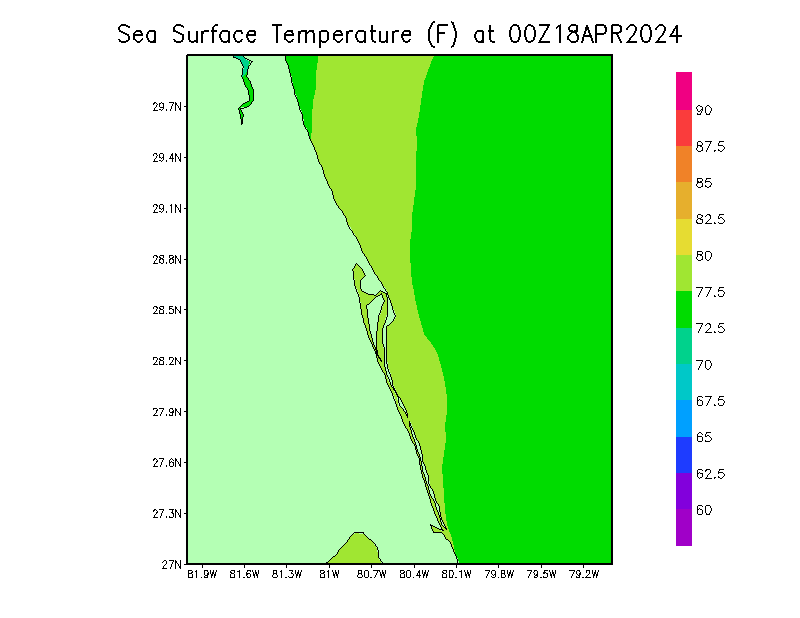
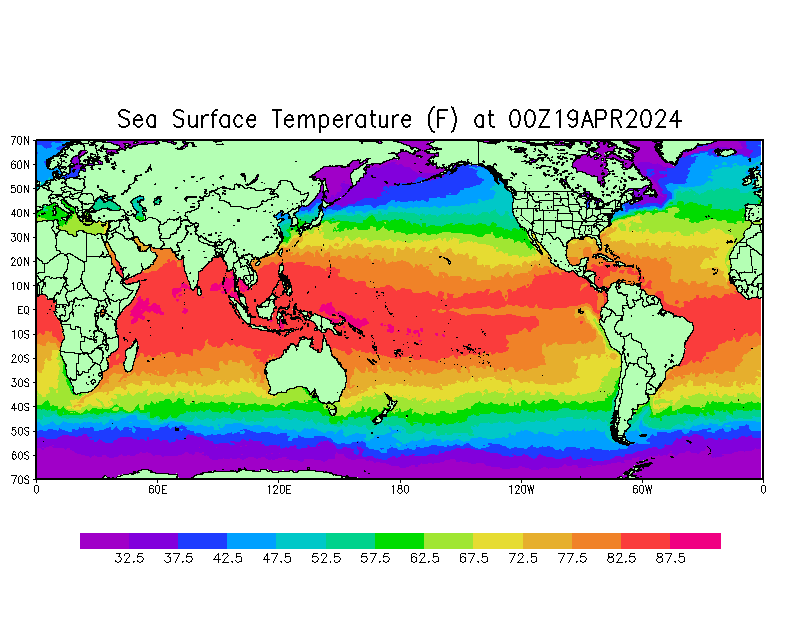
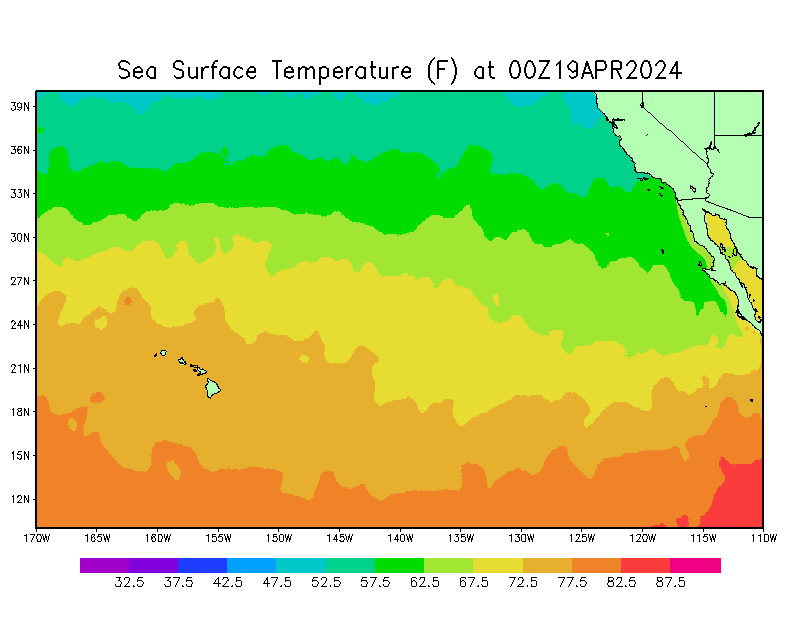
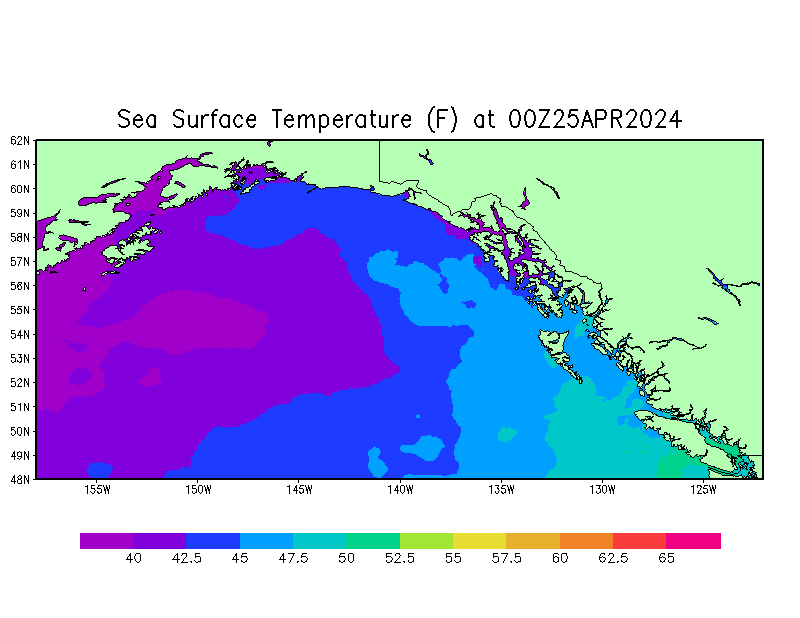
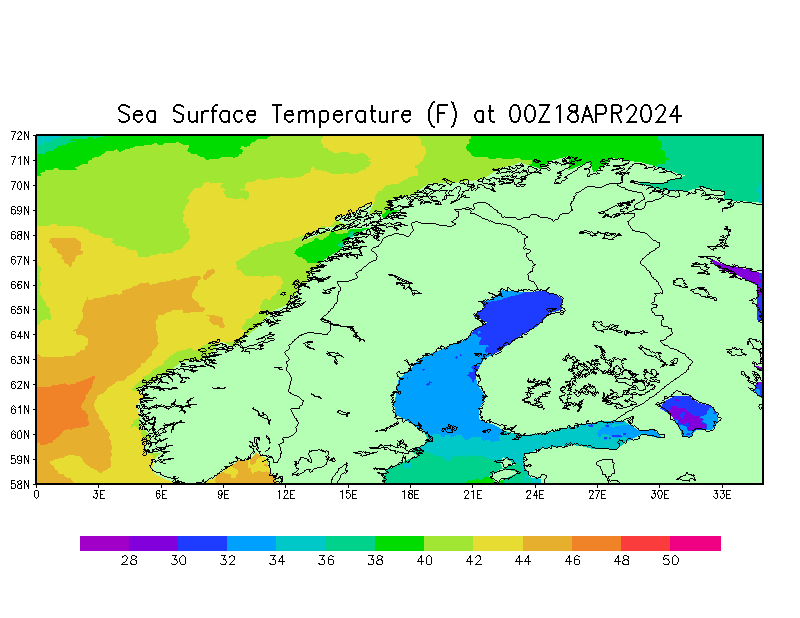
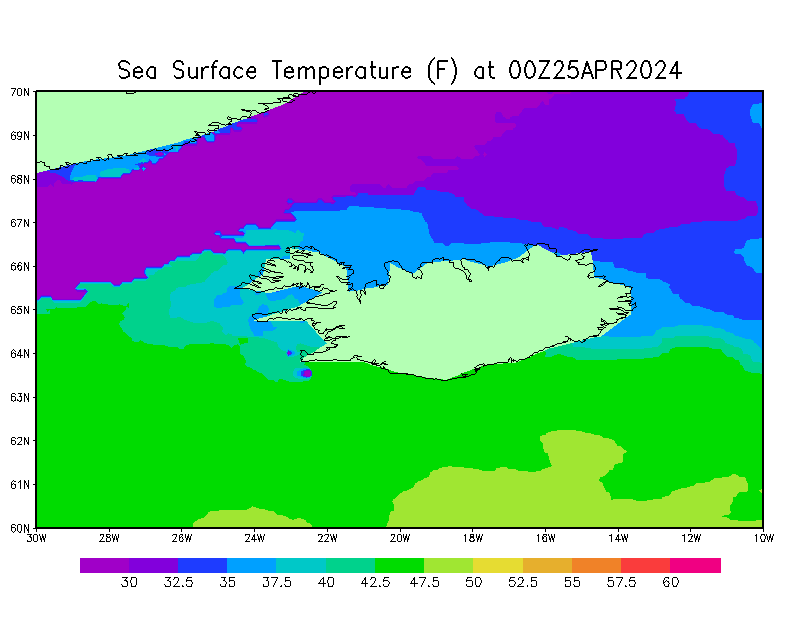
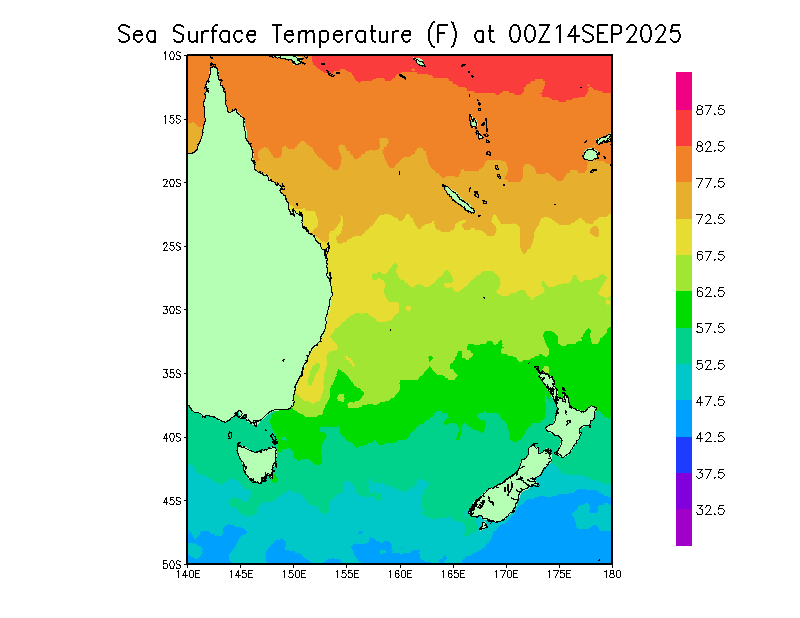
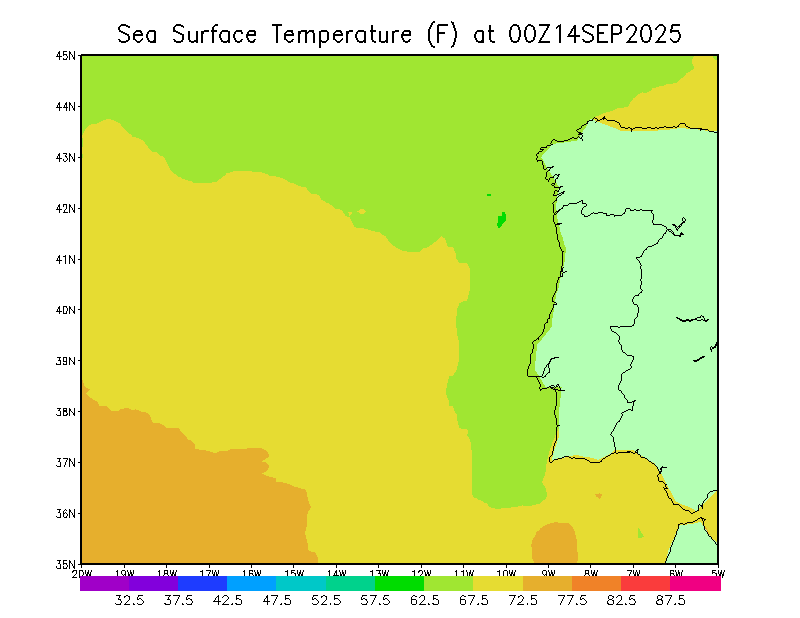
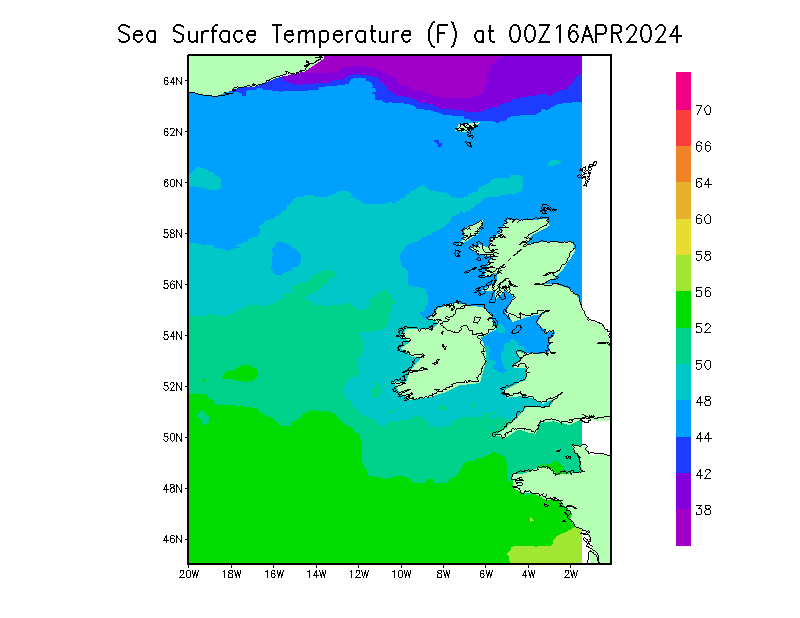
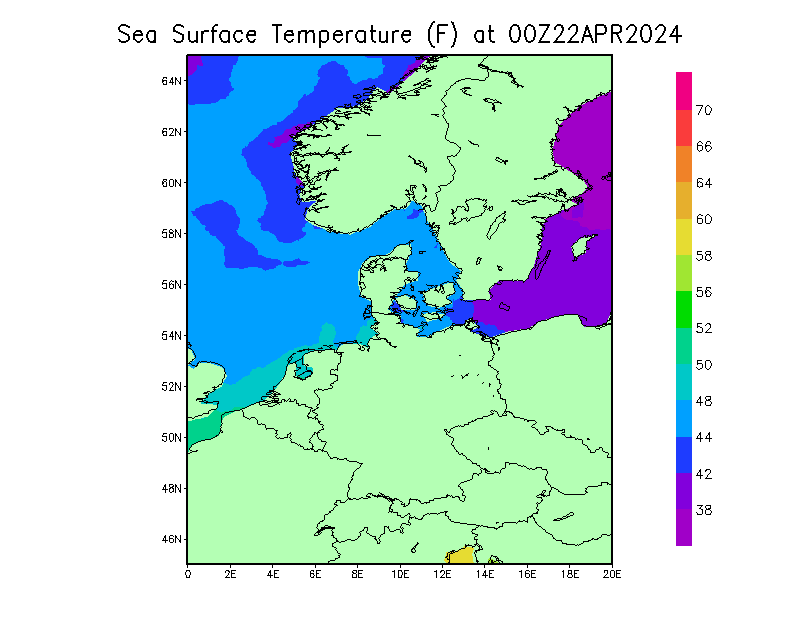
NCEP Sea Surface Temperature Analysis:
Canada Maritimes
Gulf of Mexico
FL East Coast
Entire World
North Atlantic Ocean
Eastern Pacific
Northeast Pecific (Alaska/Canada)
Galapagos Islands
Norway
Mediterranean Sea
Iceland
Australia/New Zealand
Canada Maritimes
Portugal
UK
(west of 0)
(east of 0)
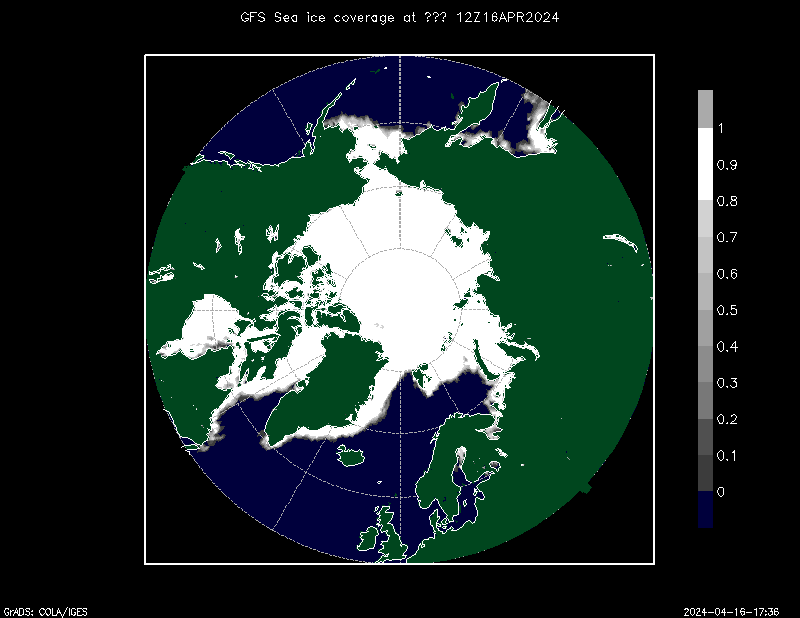
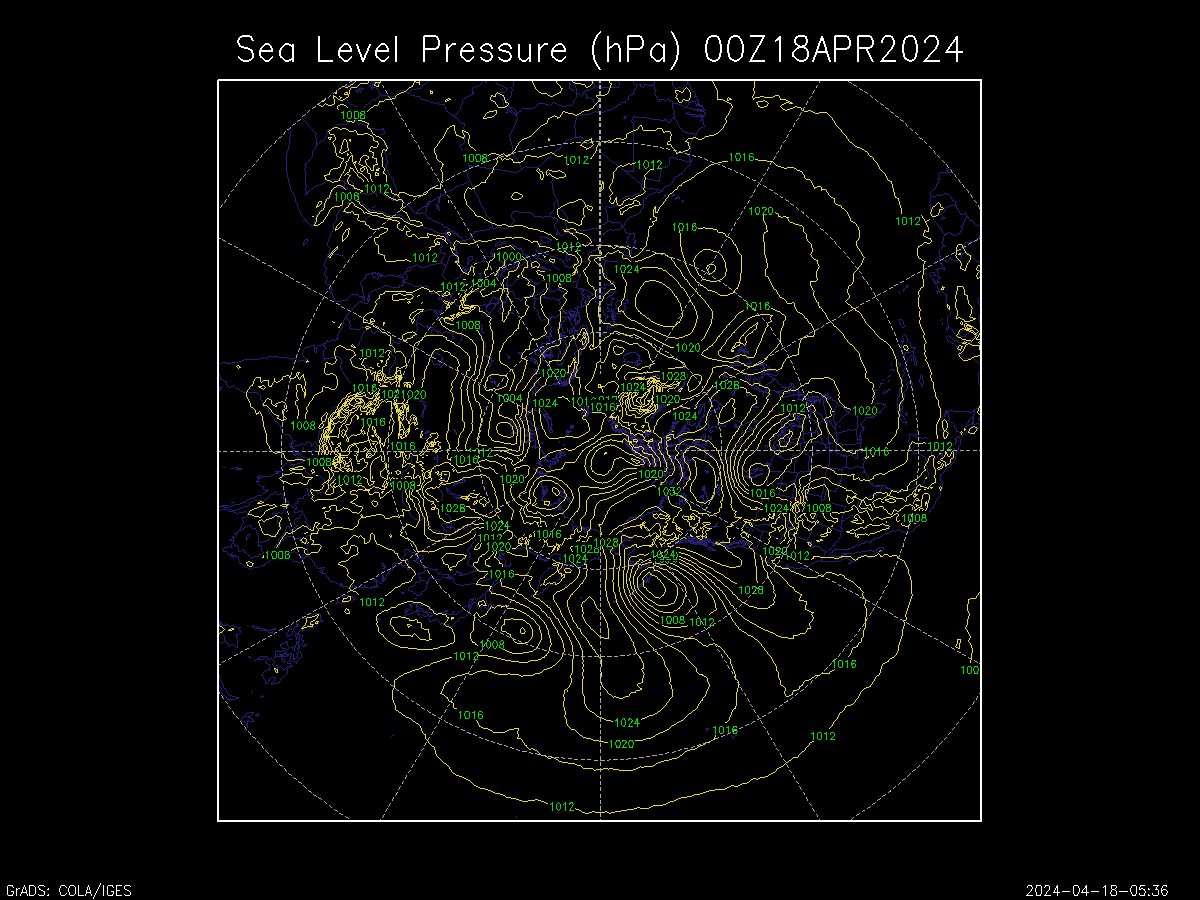
Sea ice coverage
North Polar region
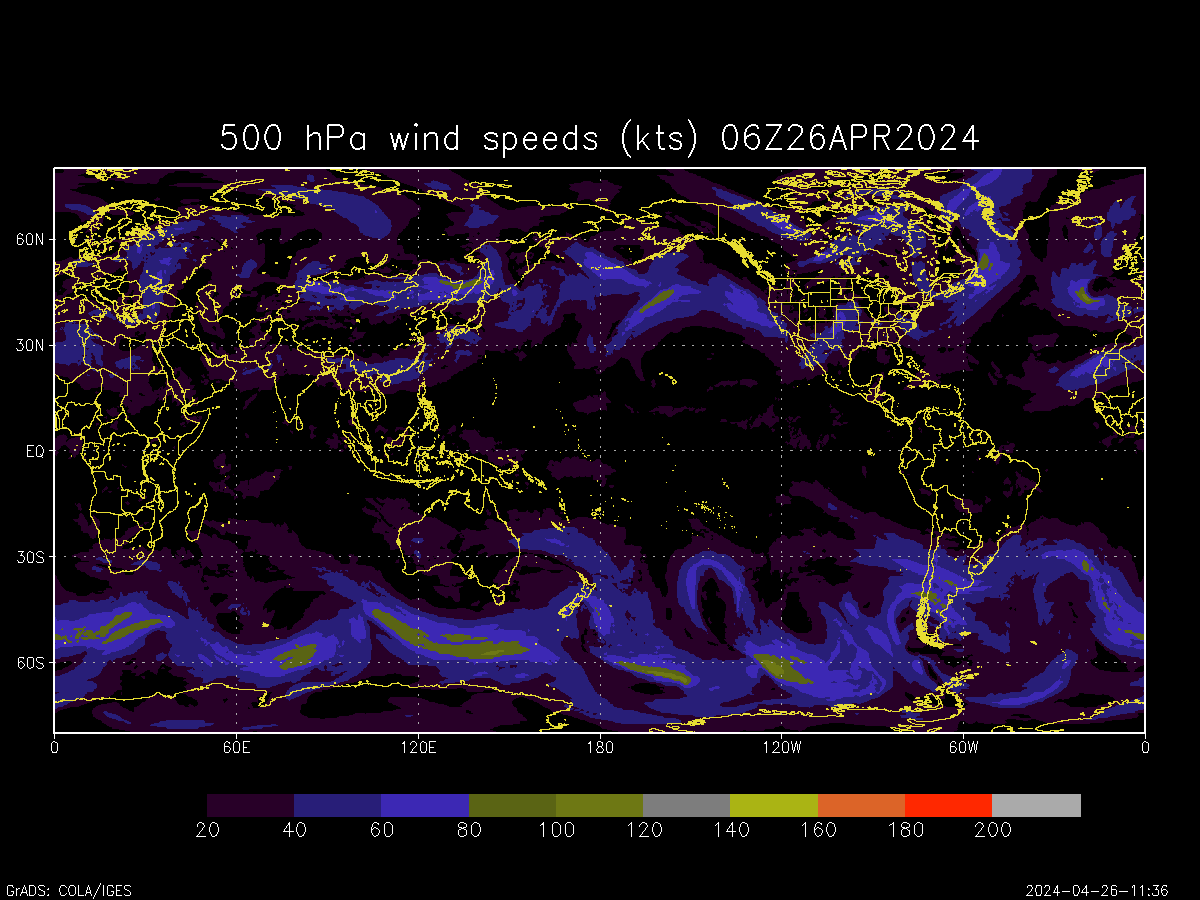
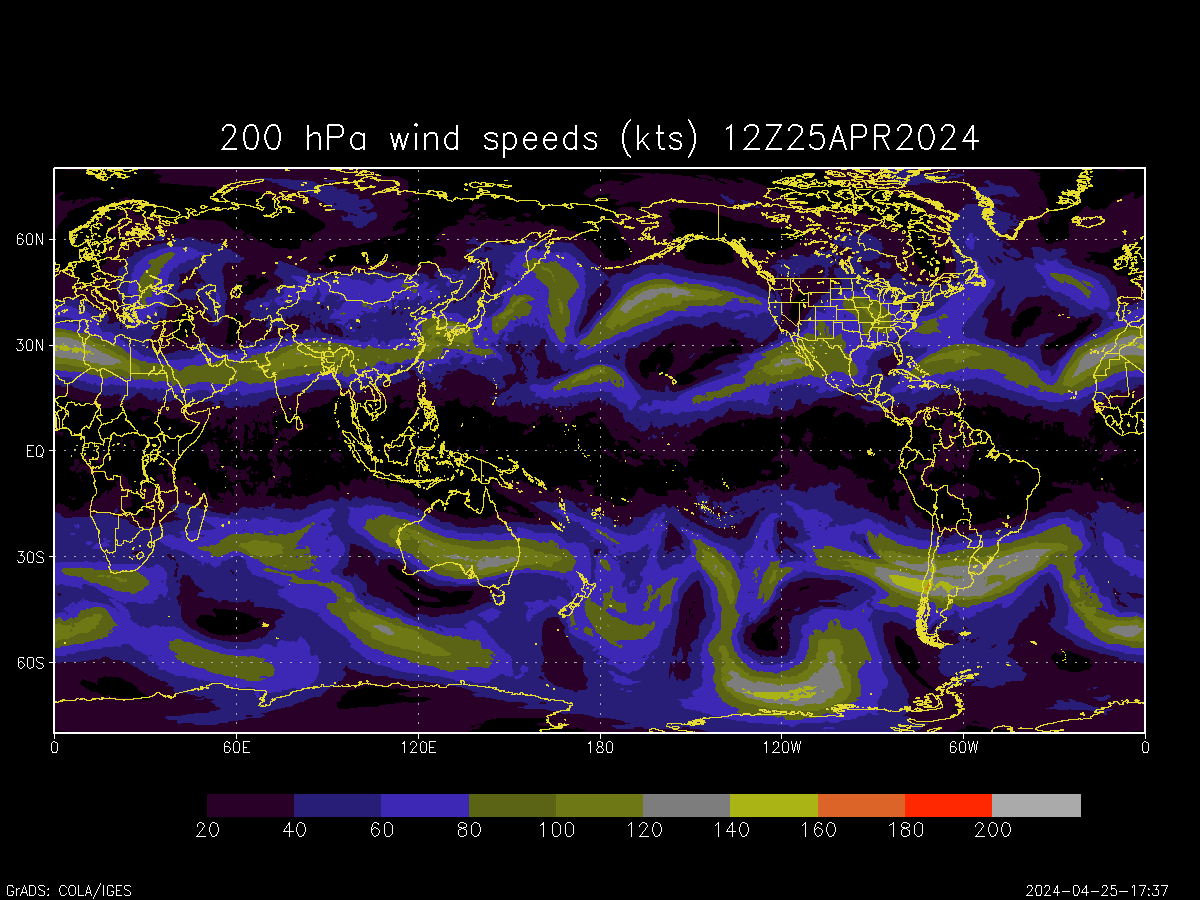
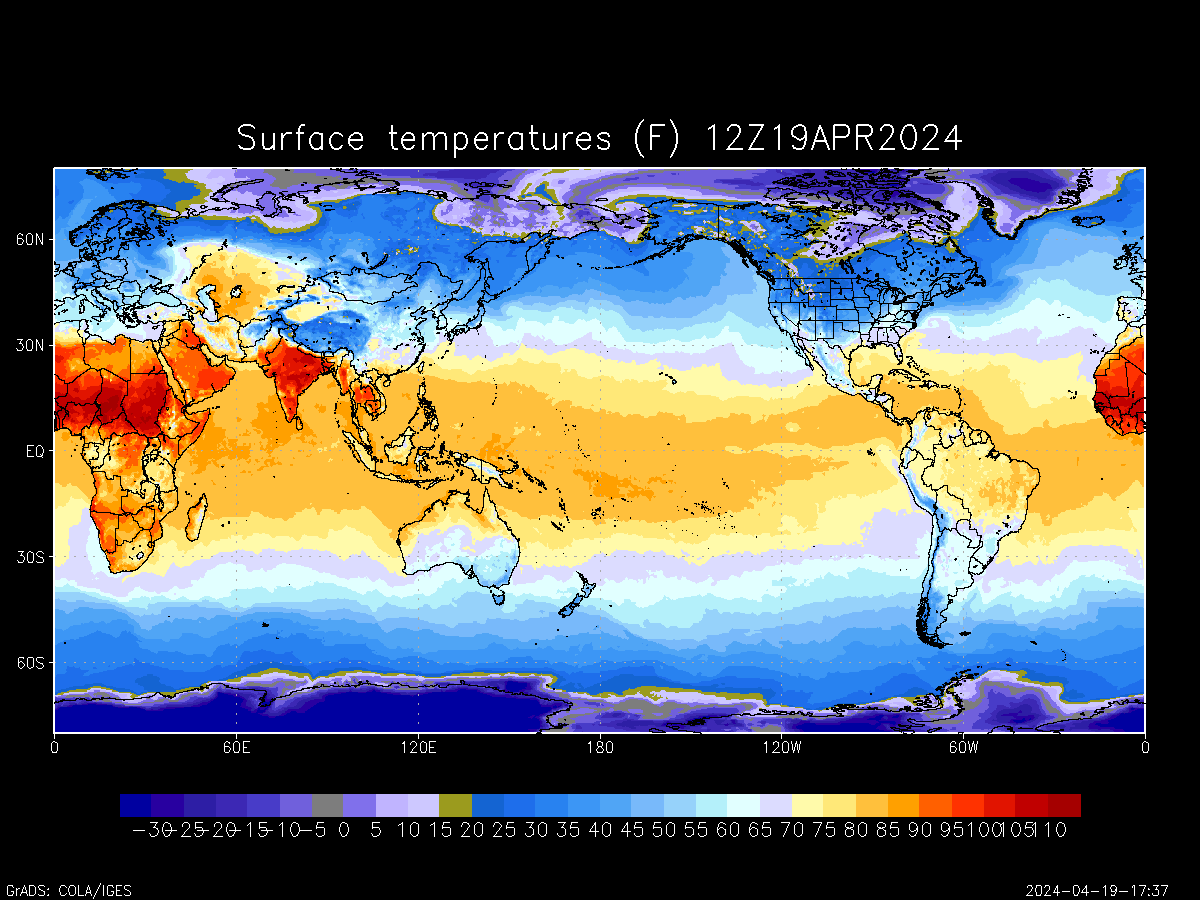
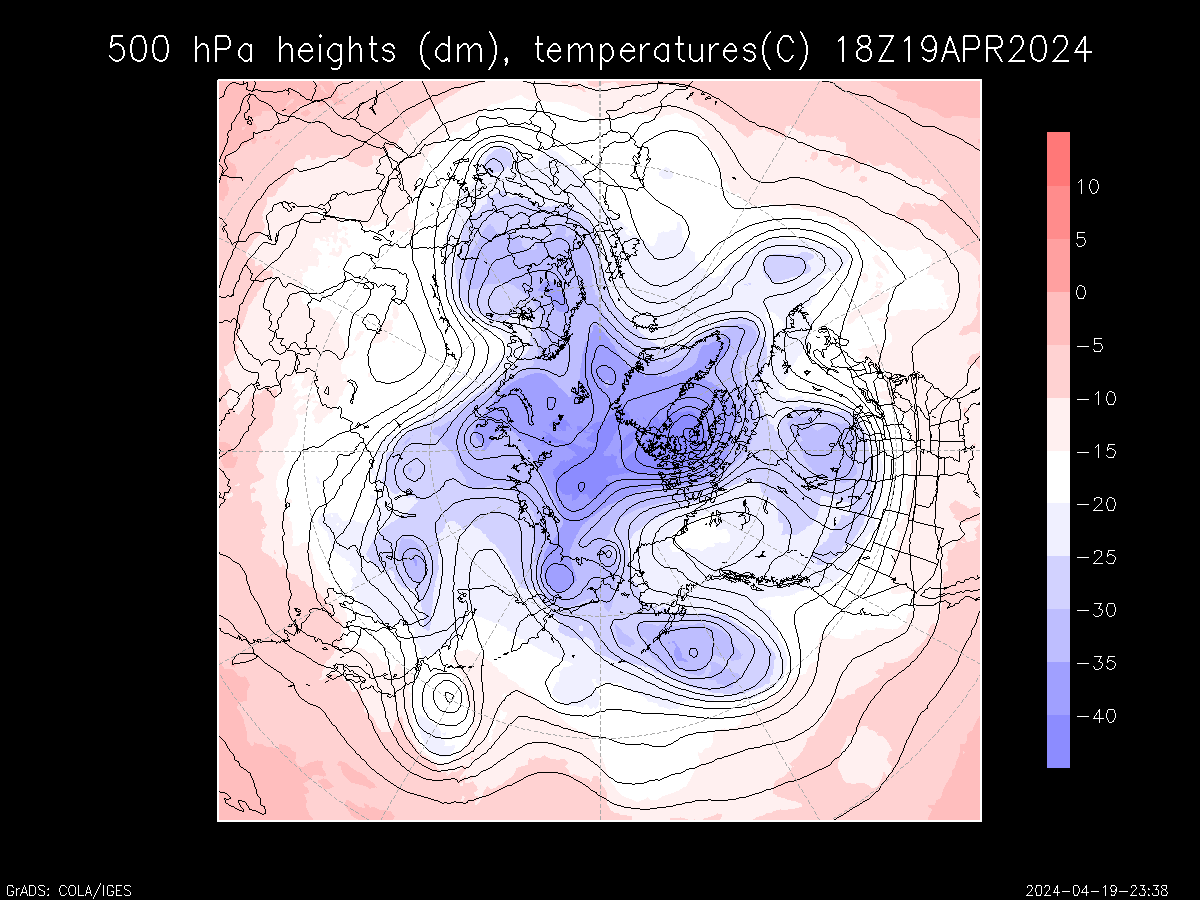
Global temperatures and jet streams
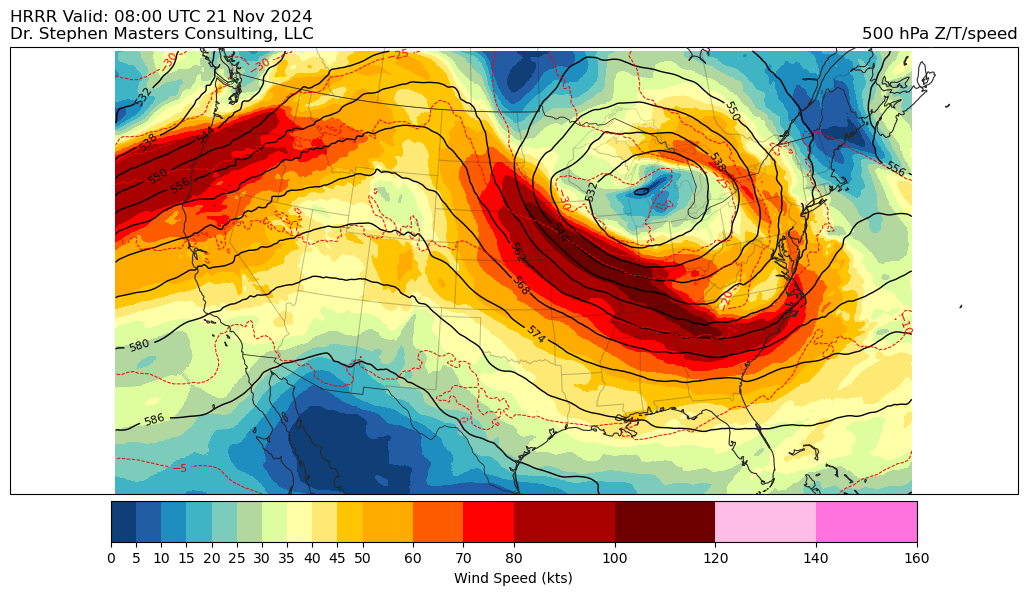
500 hPa jets
200 hPa jets
Surface temperatures
Northern hemisphere
500 hPa heights/temps
500 hPa heights/temps
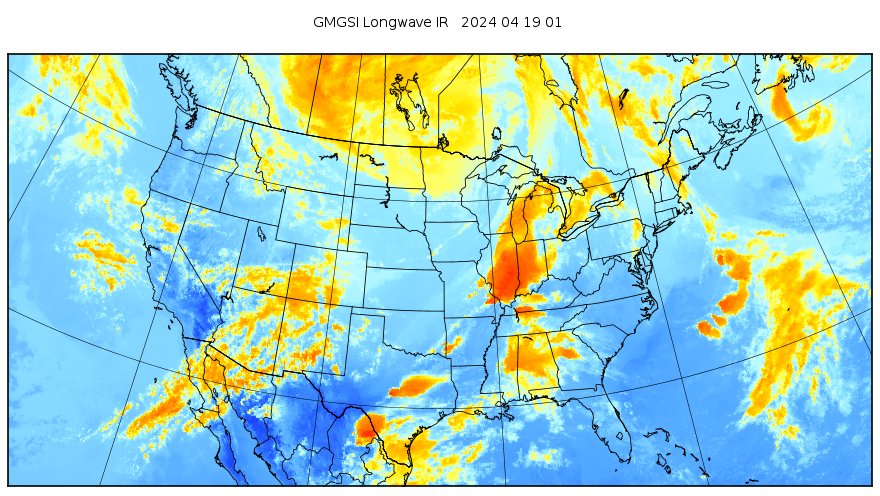
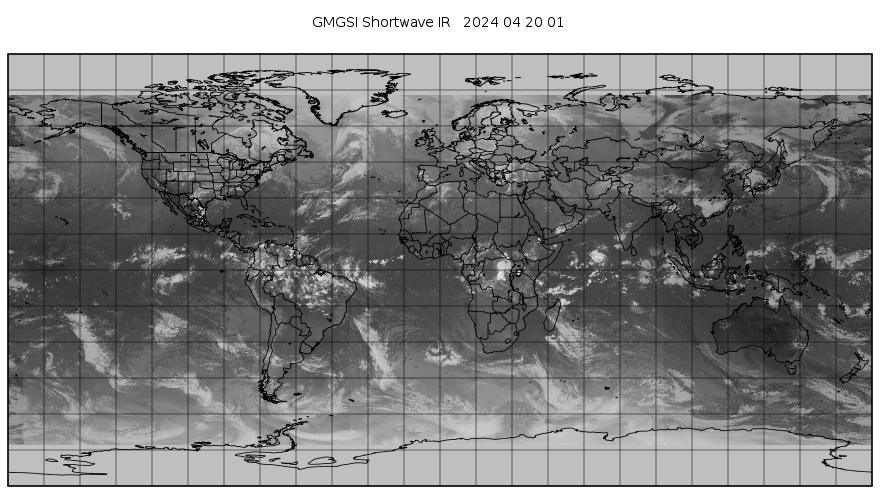
Global GMGSI satellite
Visible
Water Vapor
Shortwave IR
Longwave IR
See my GMGSI satellite page for more information about these images.
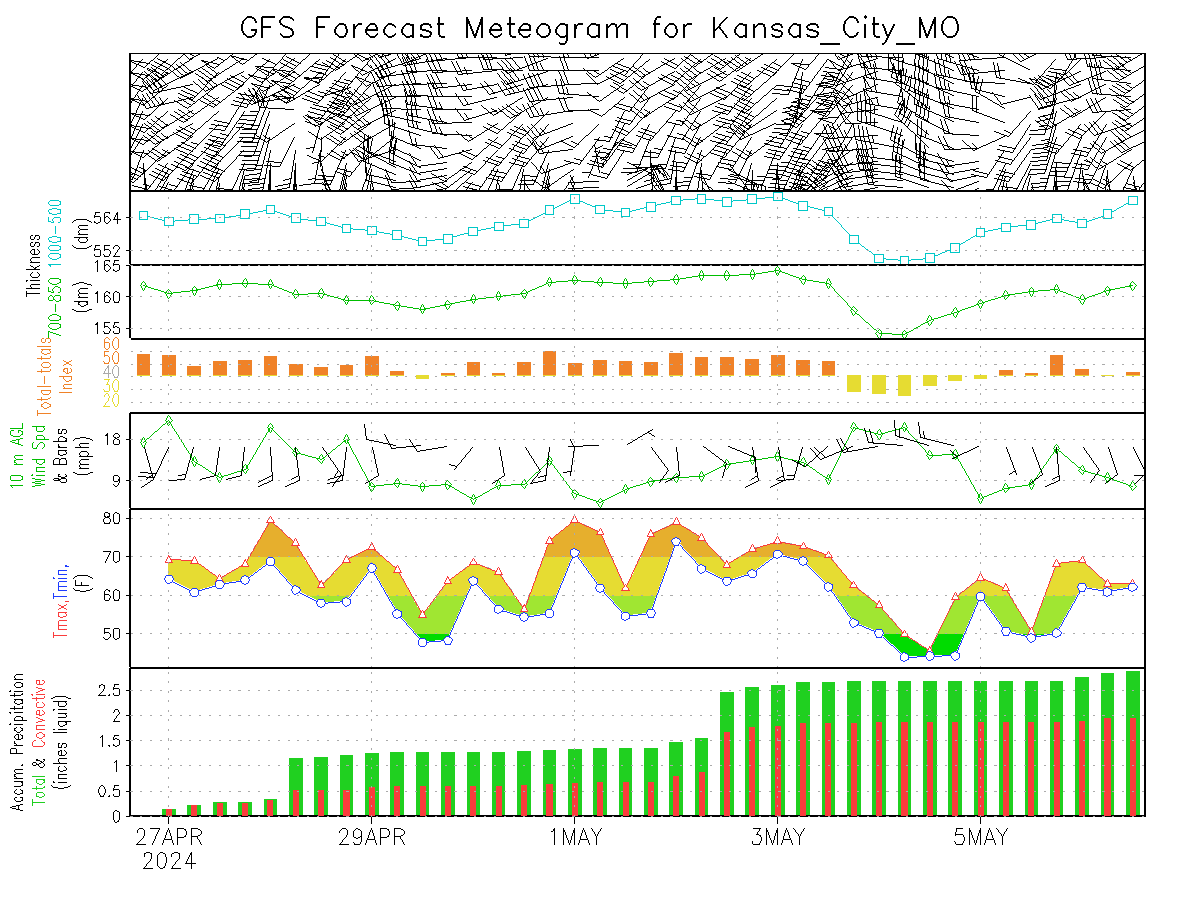
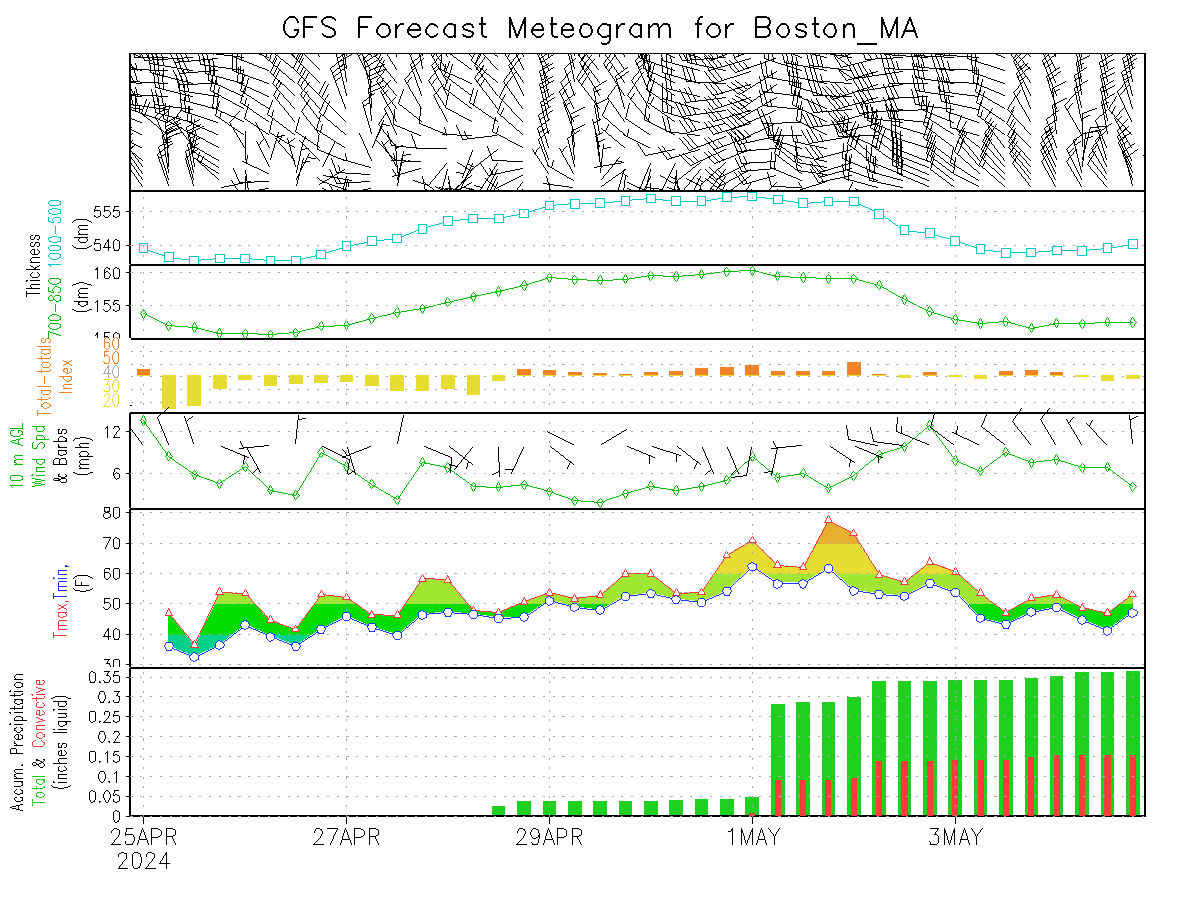
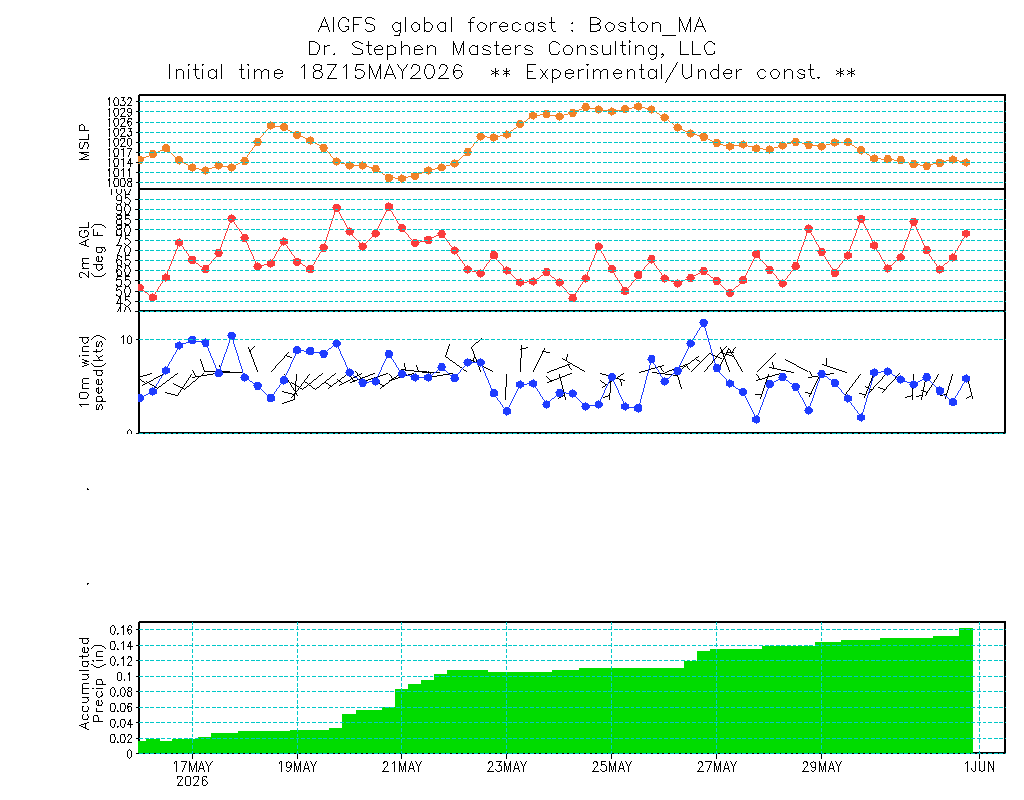
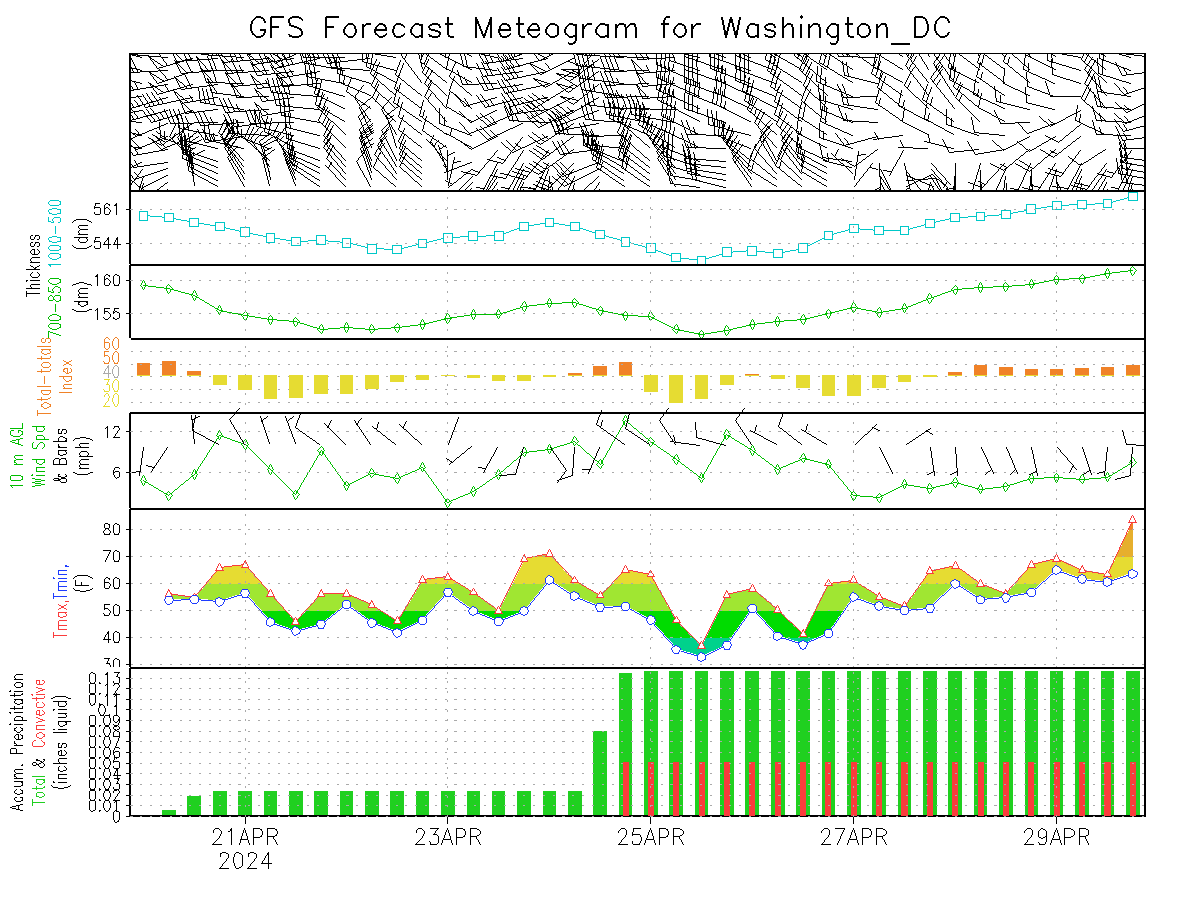
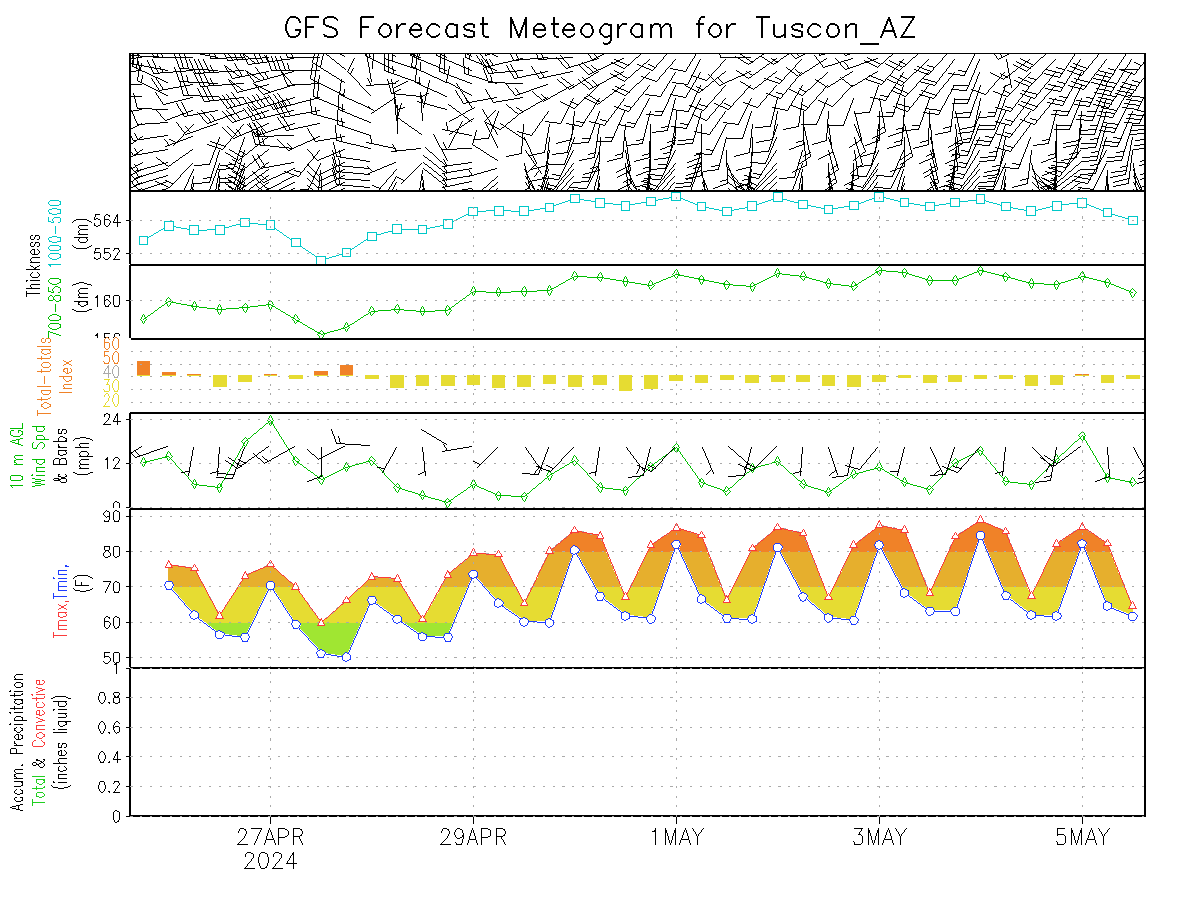
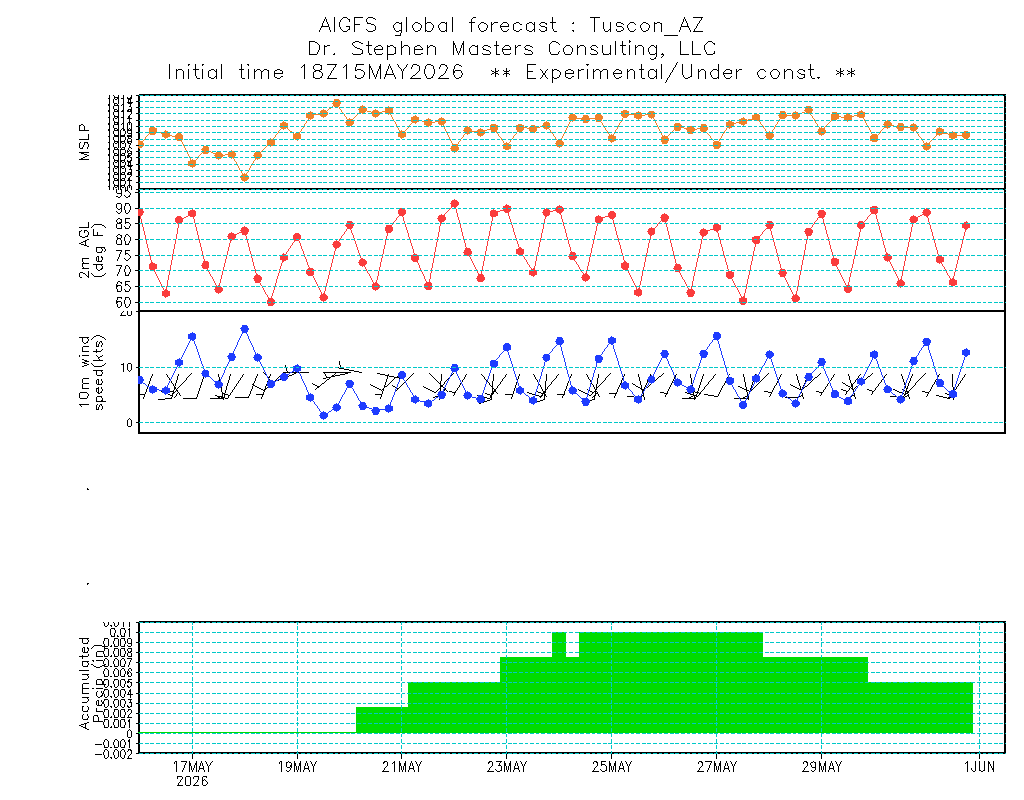
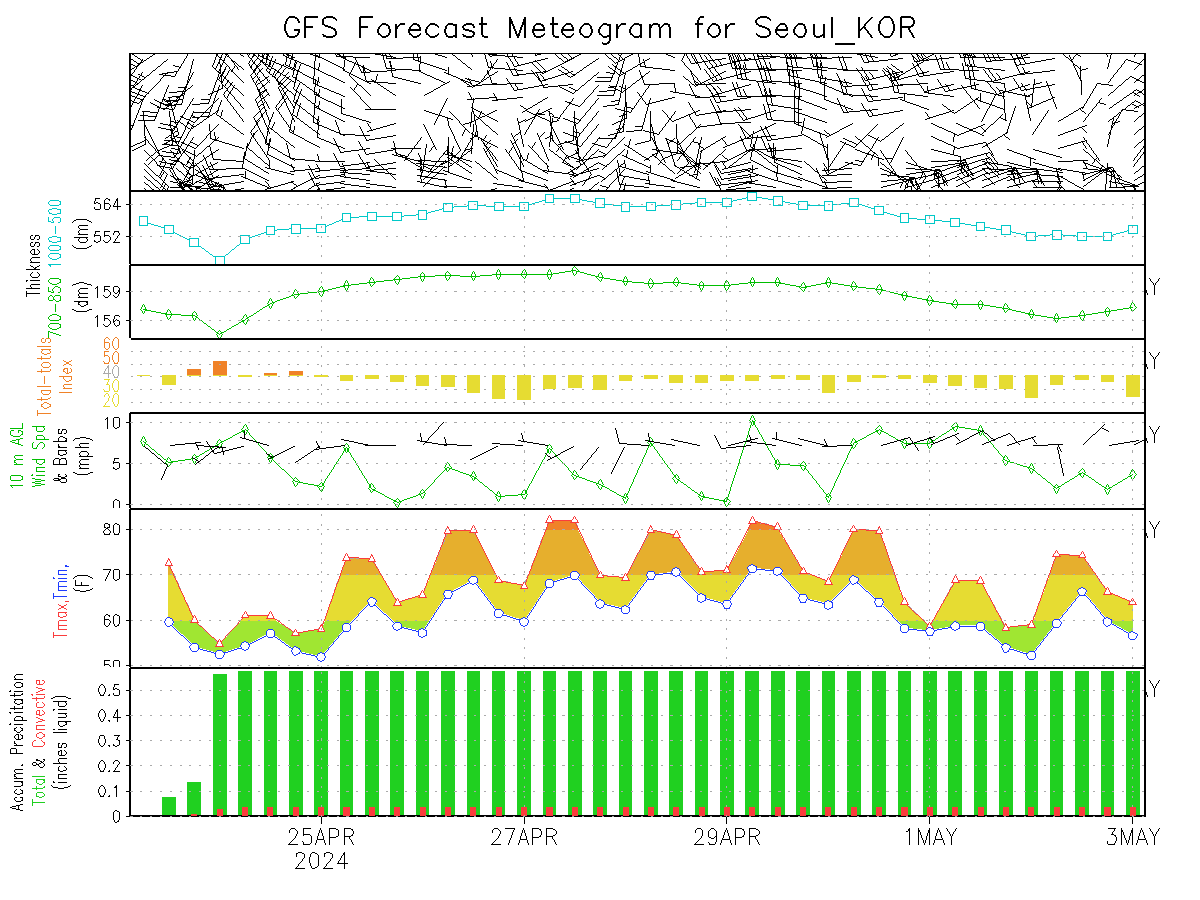
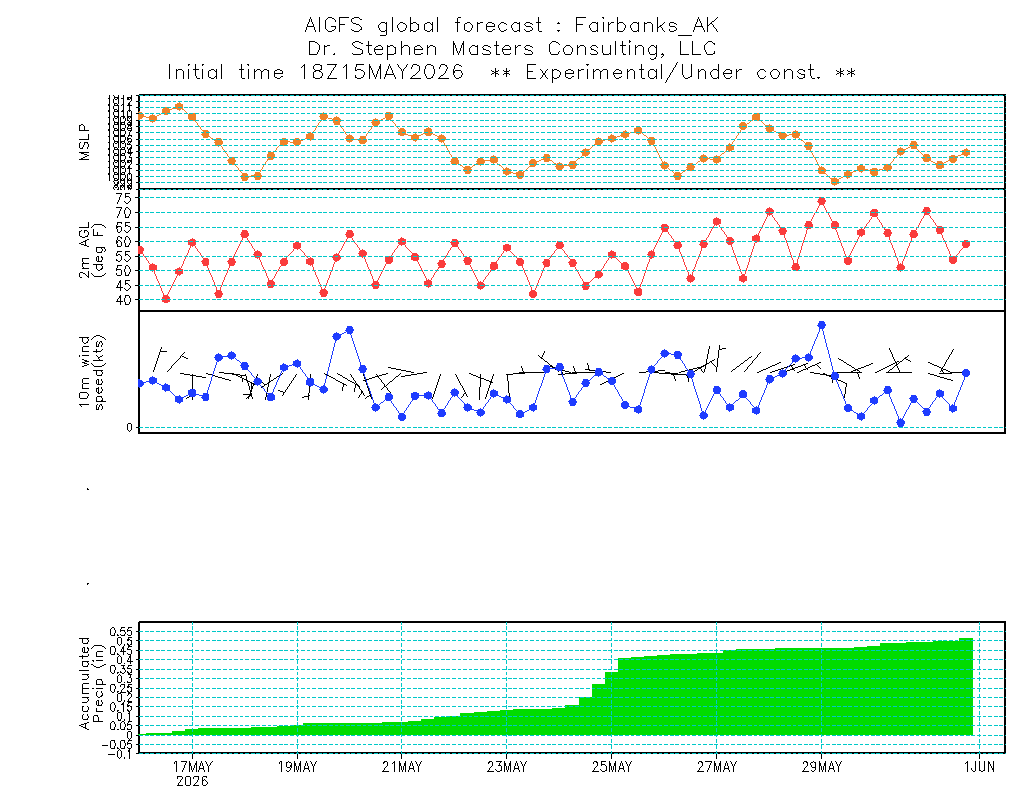
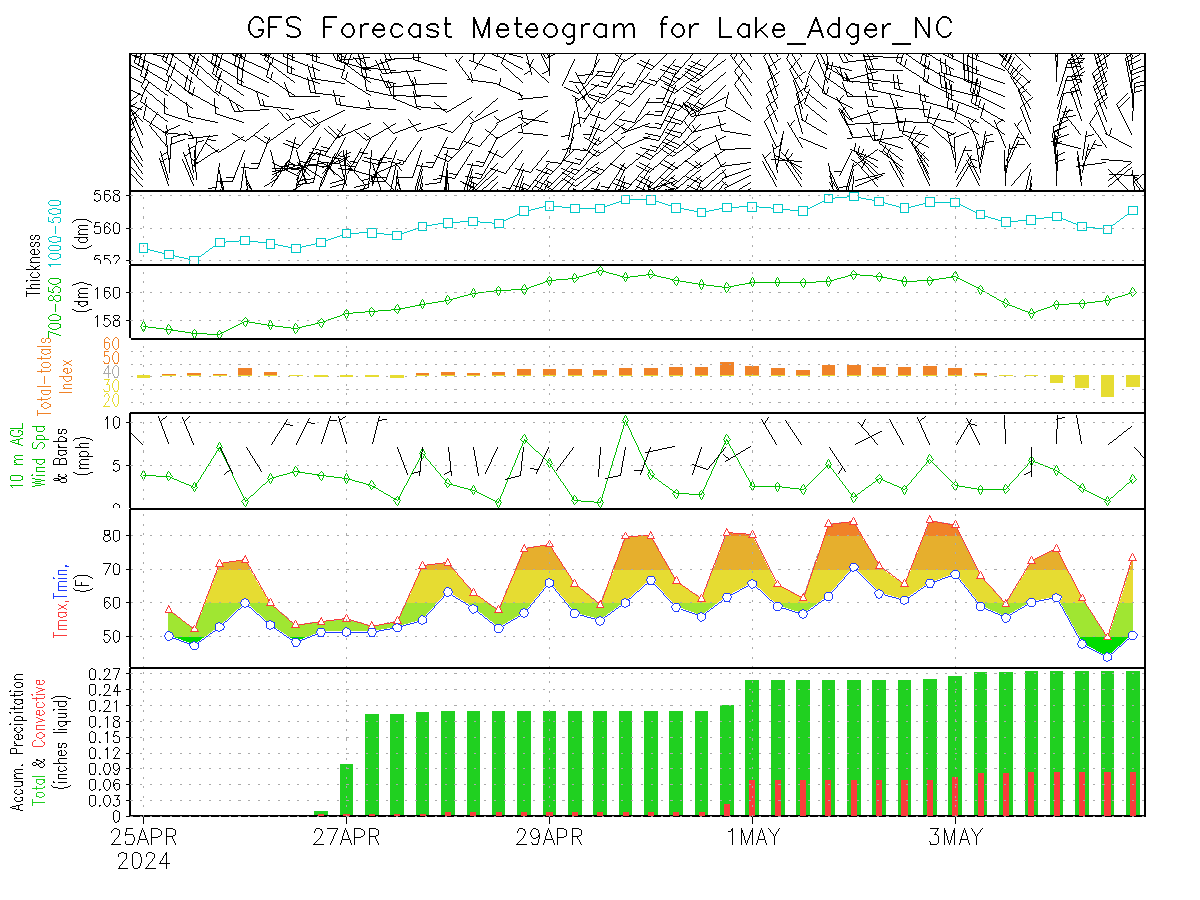
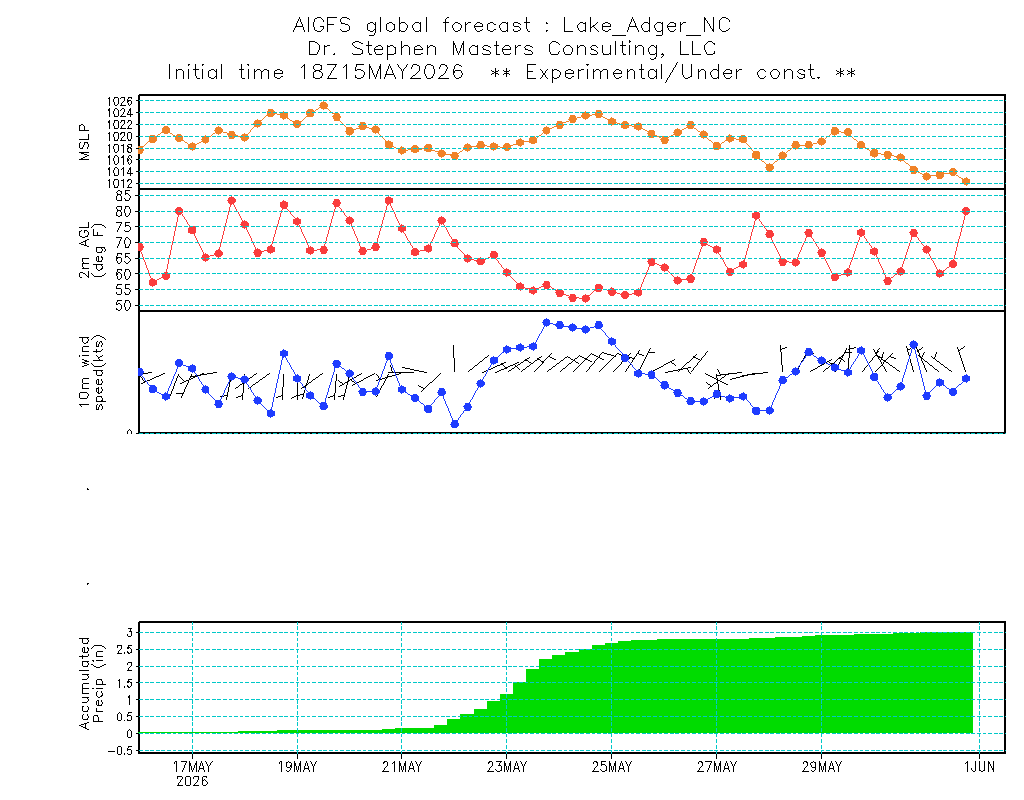
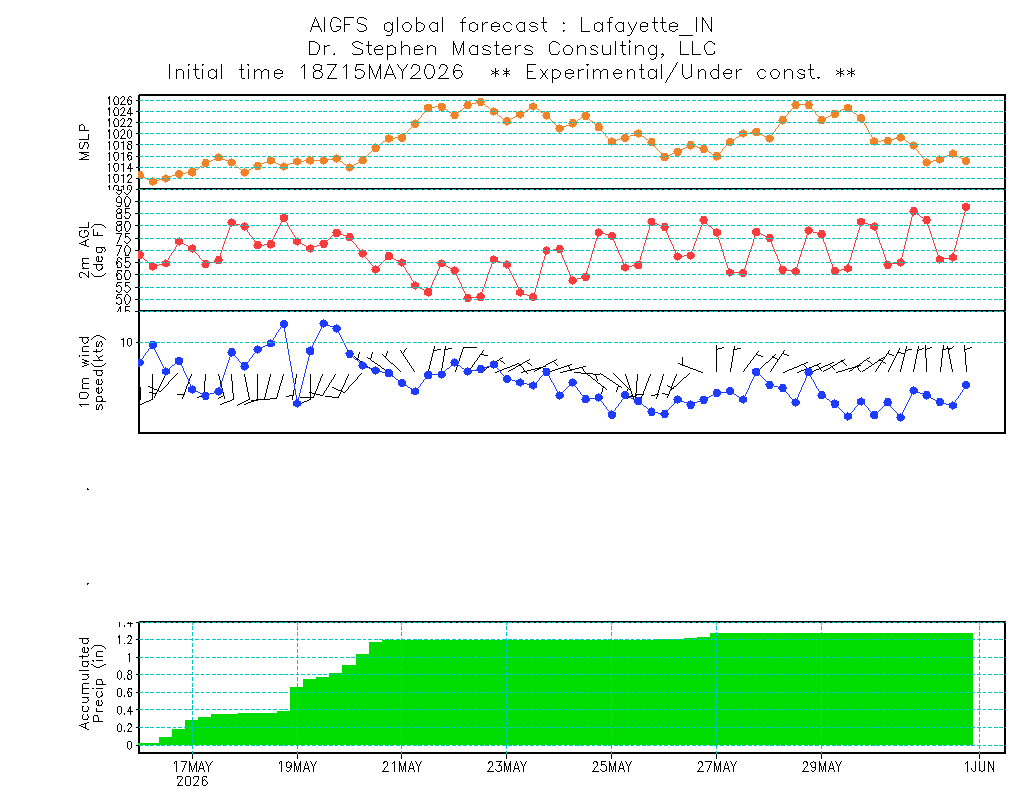
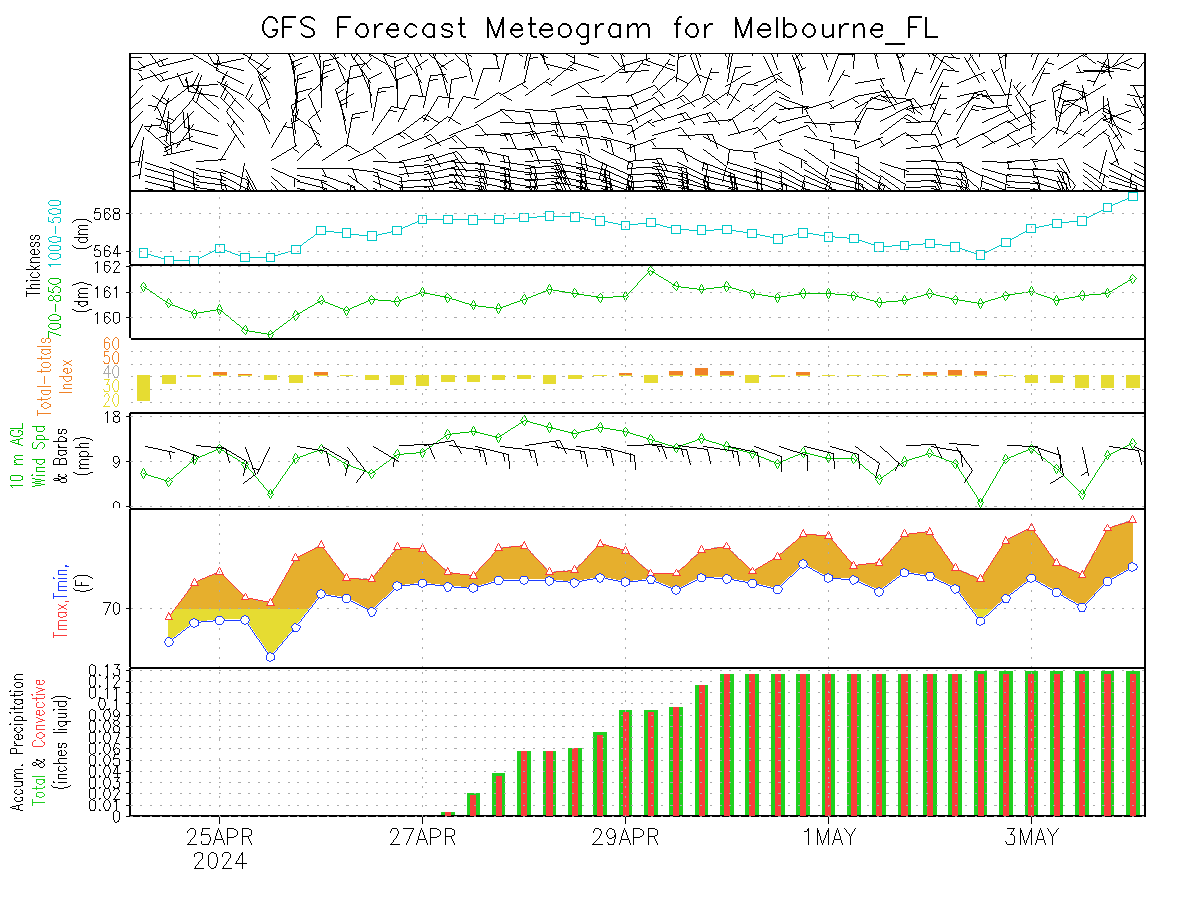
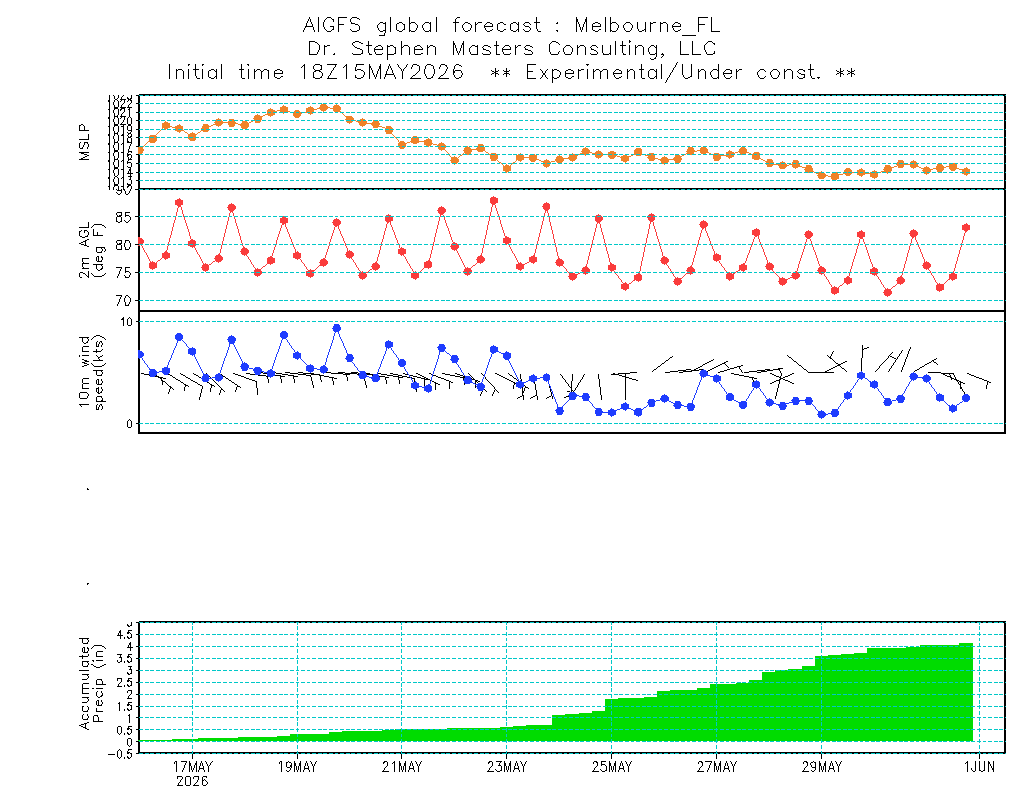
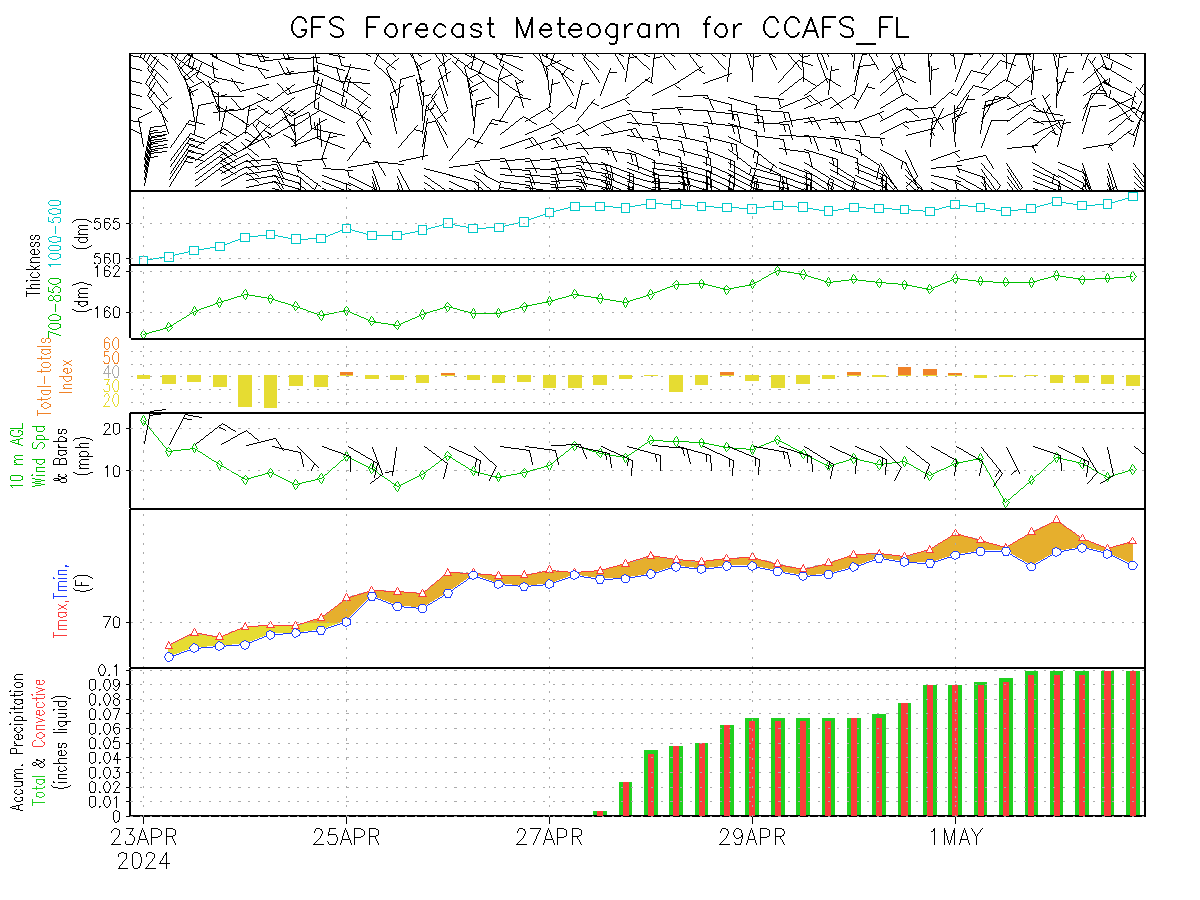
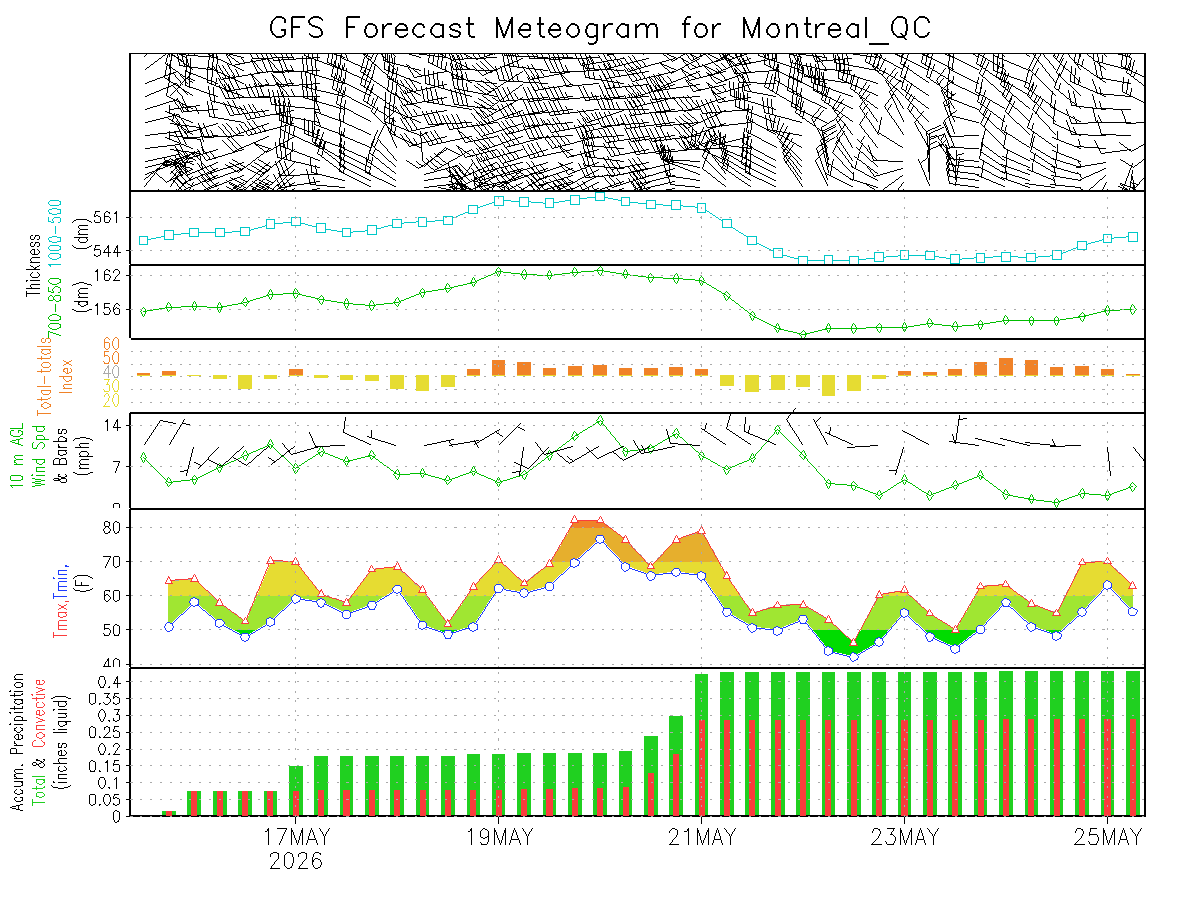
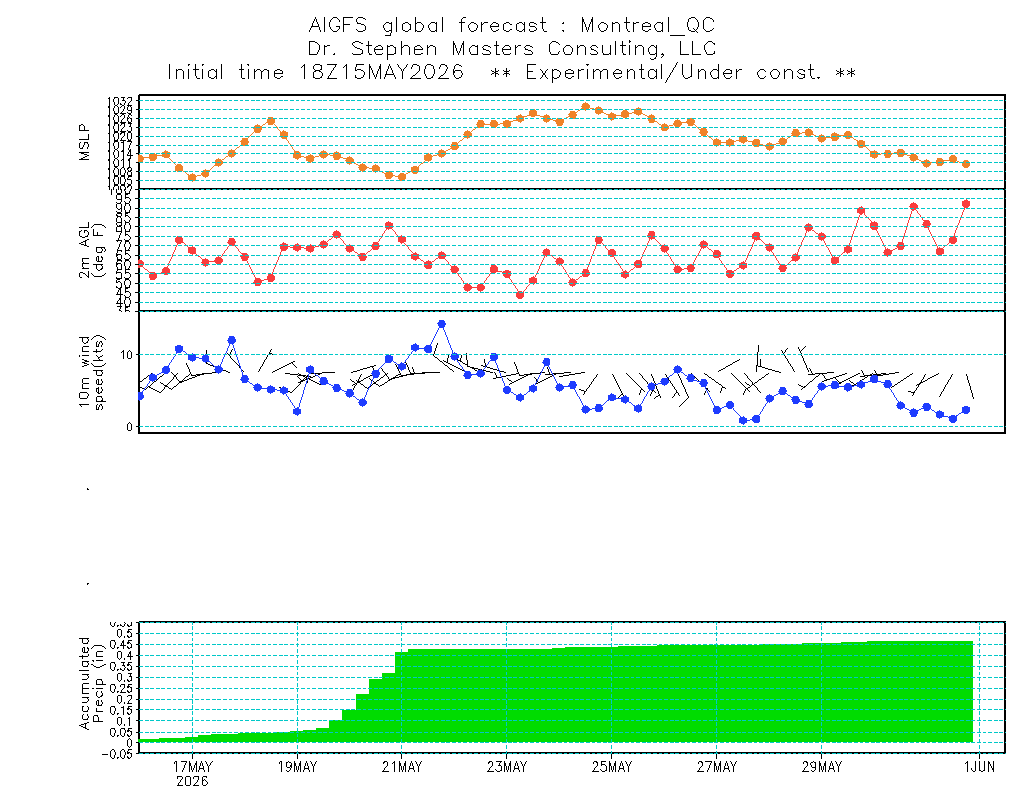
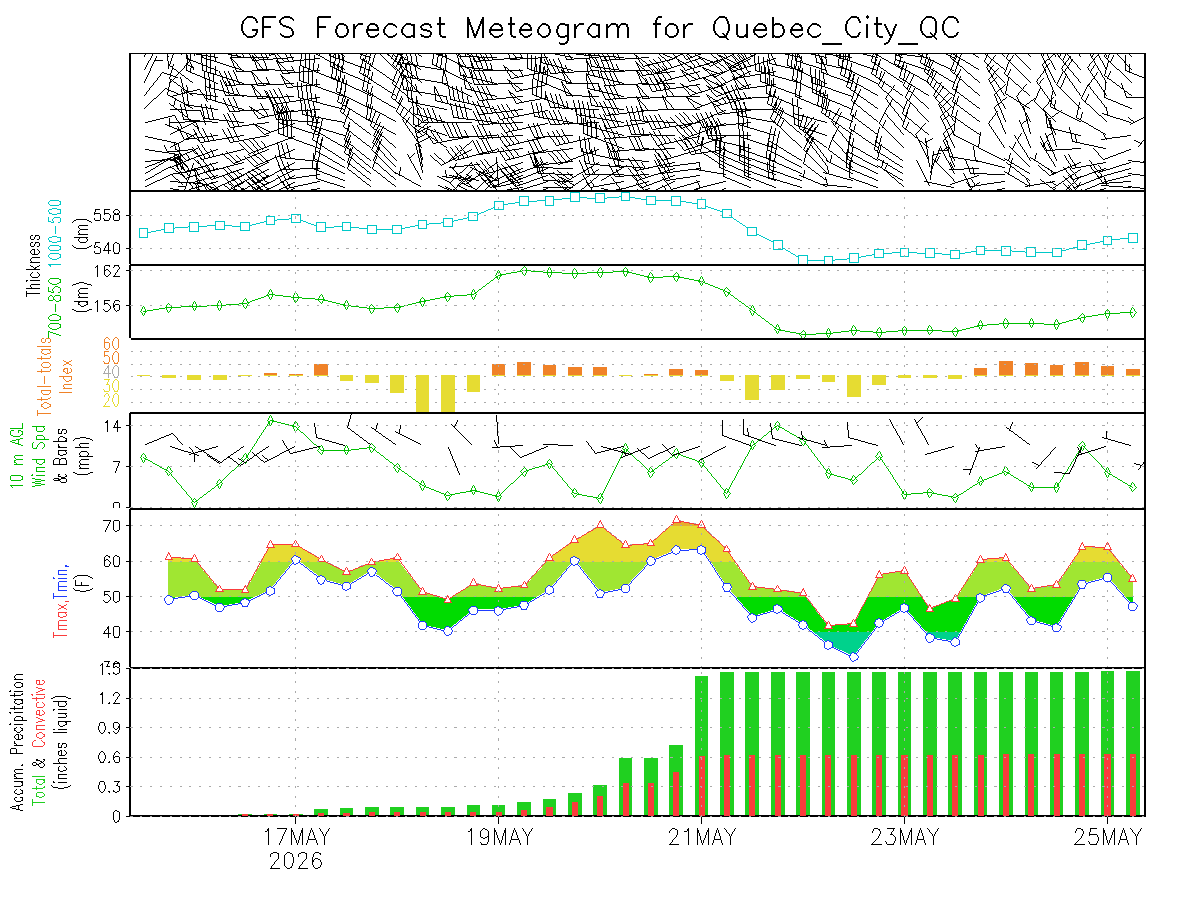
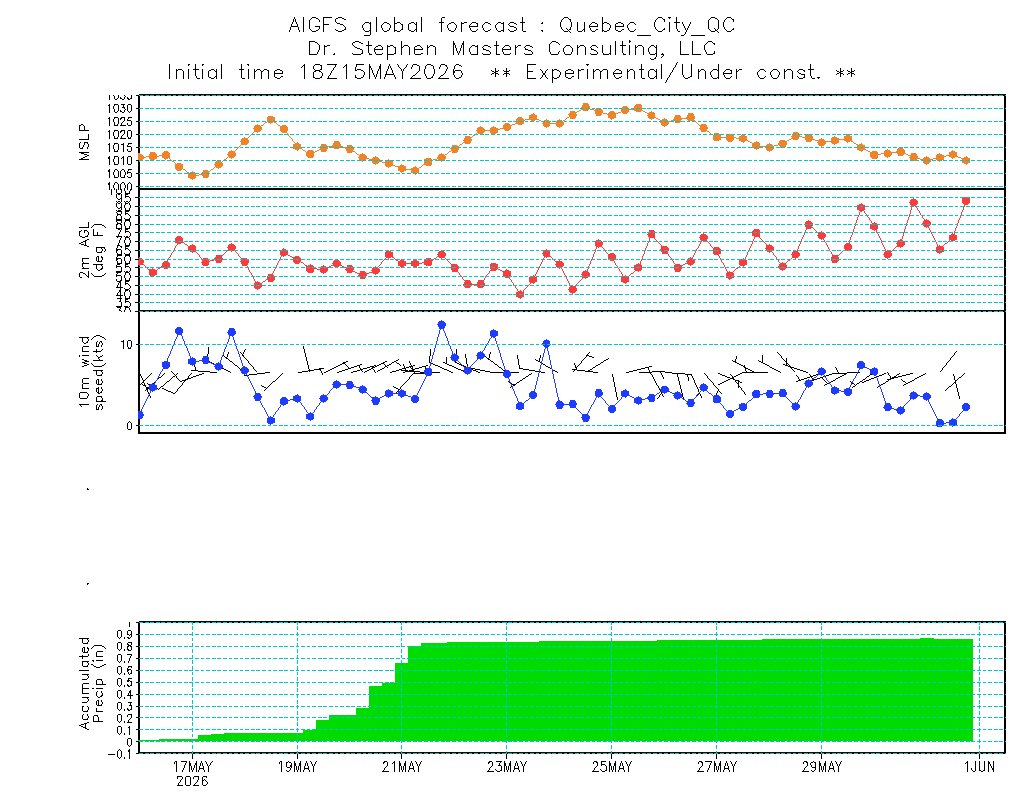
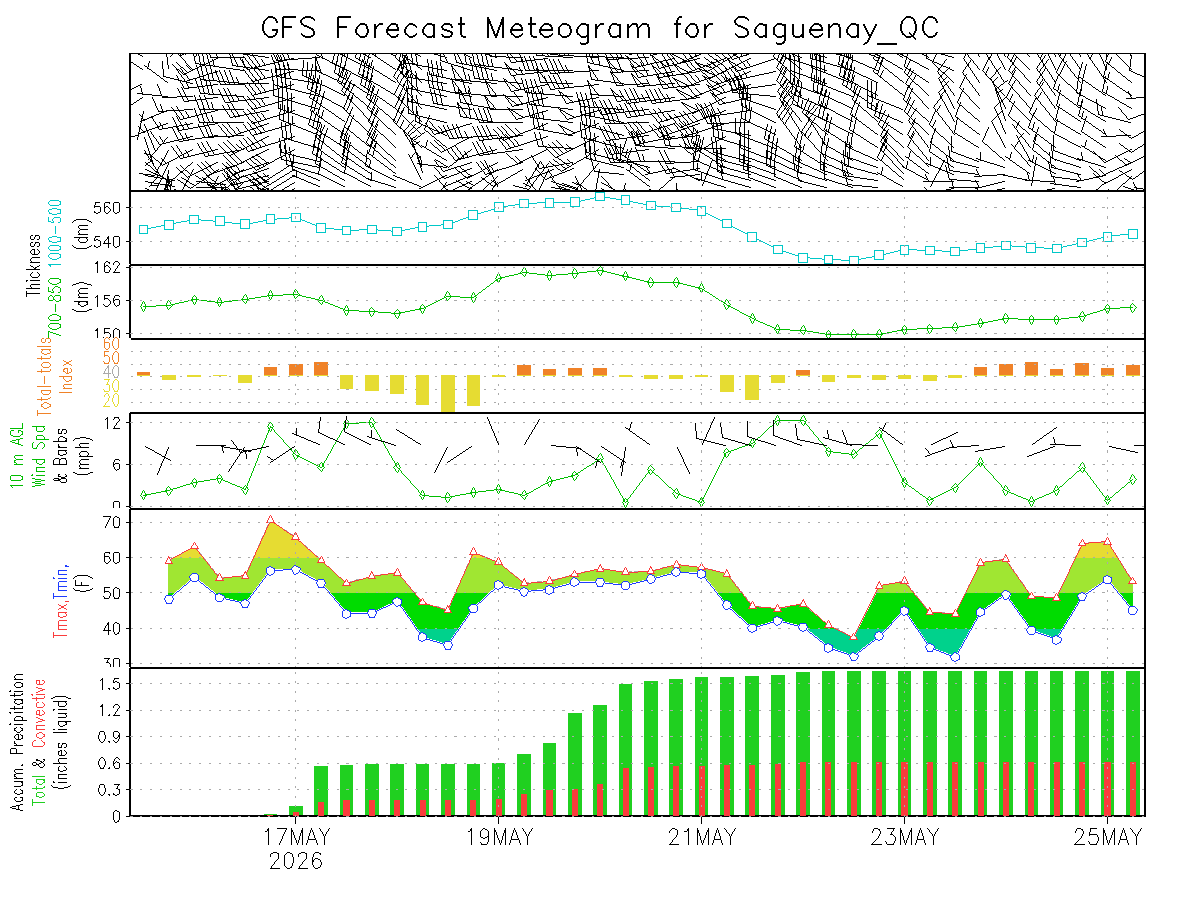
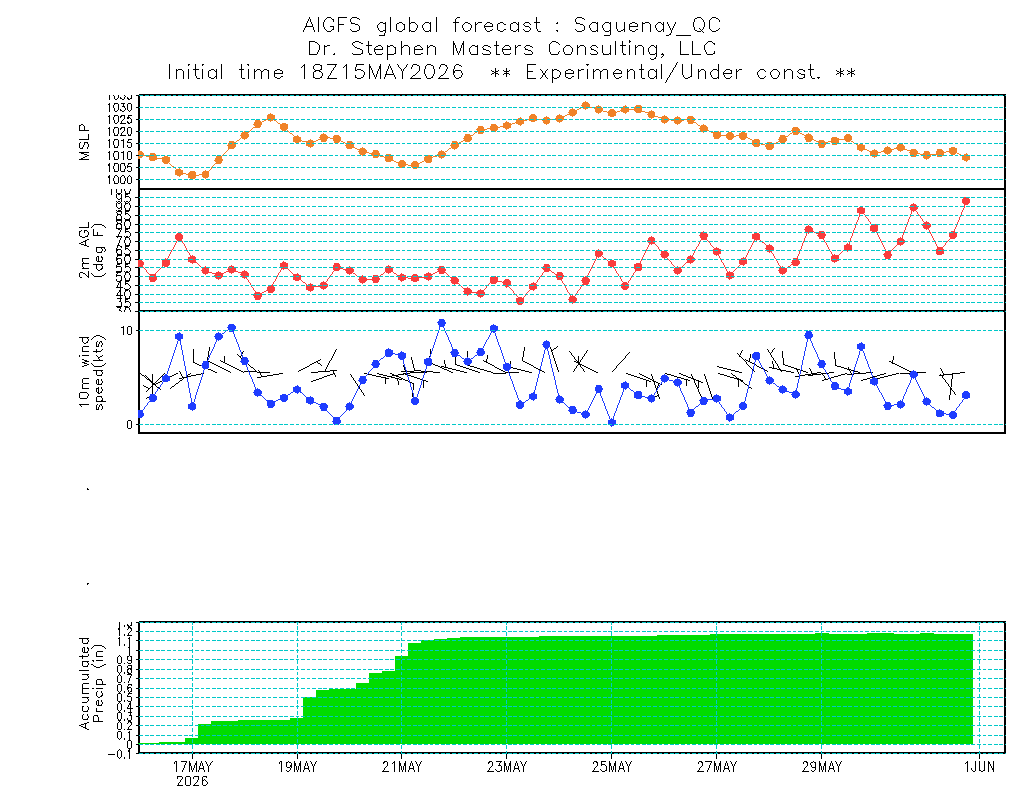
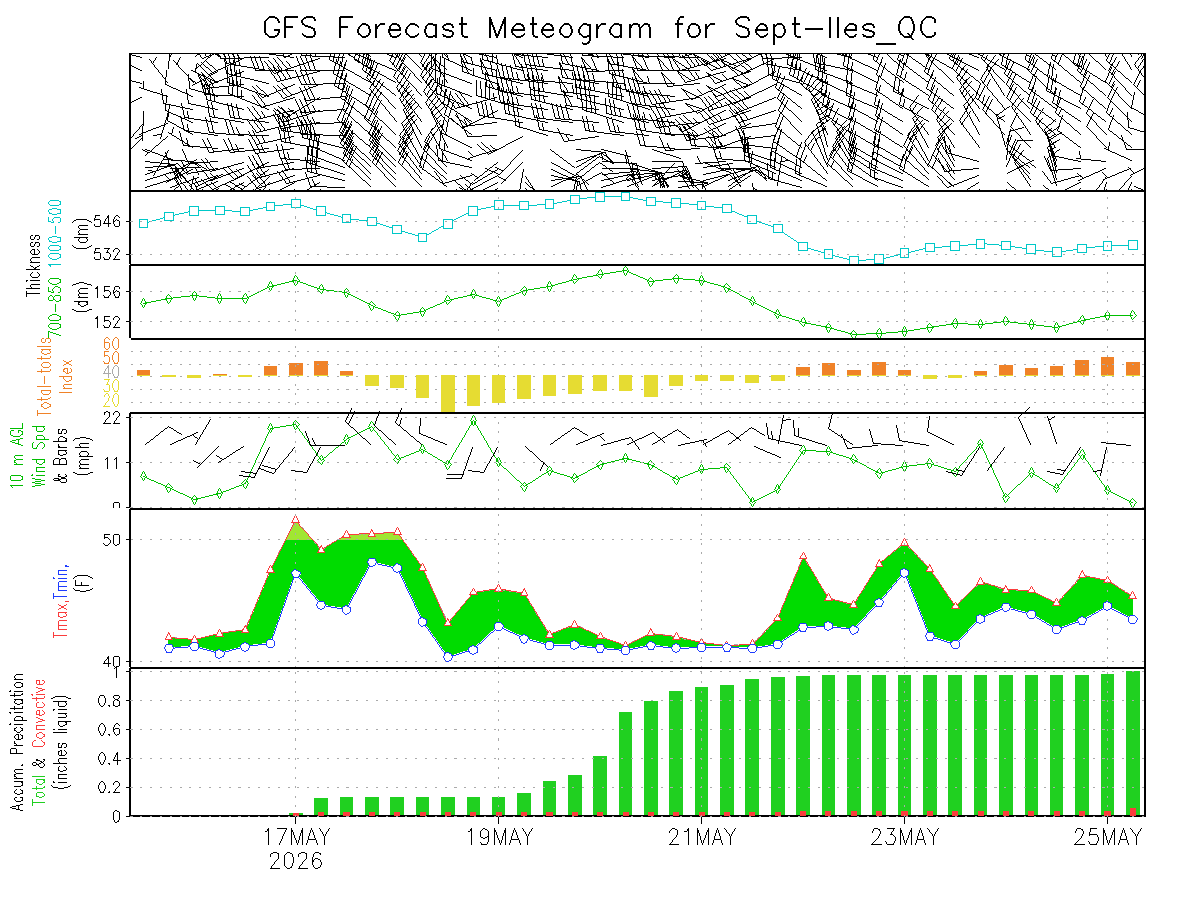
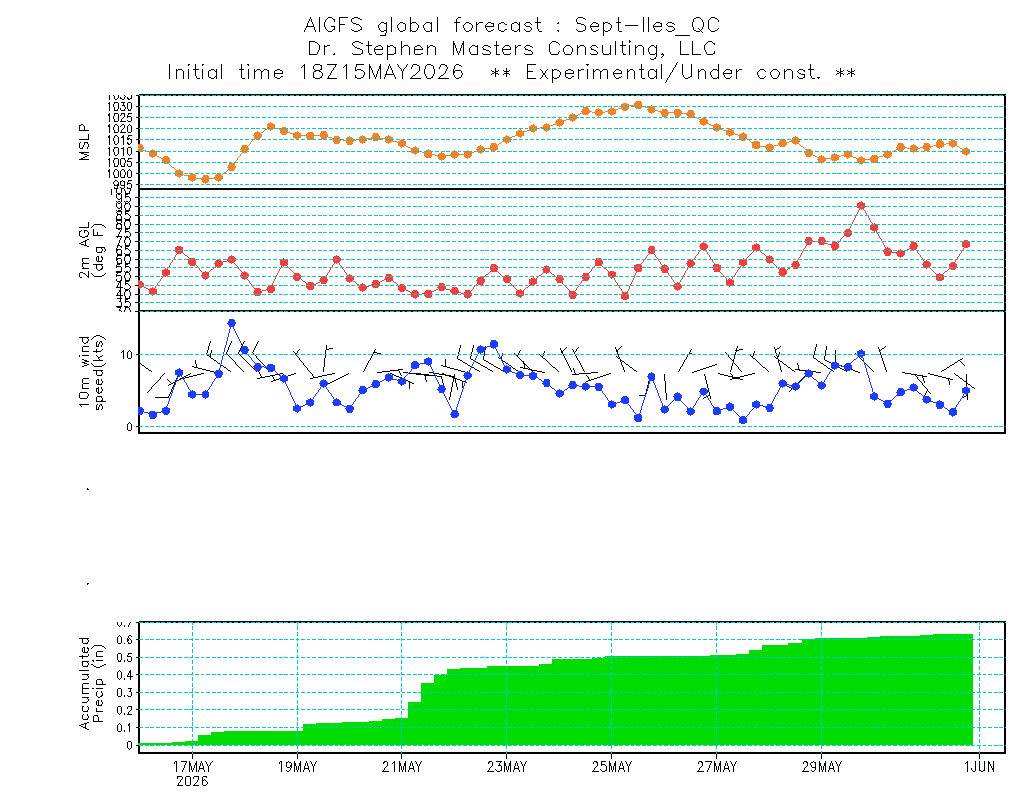
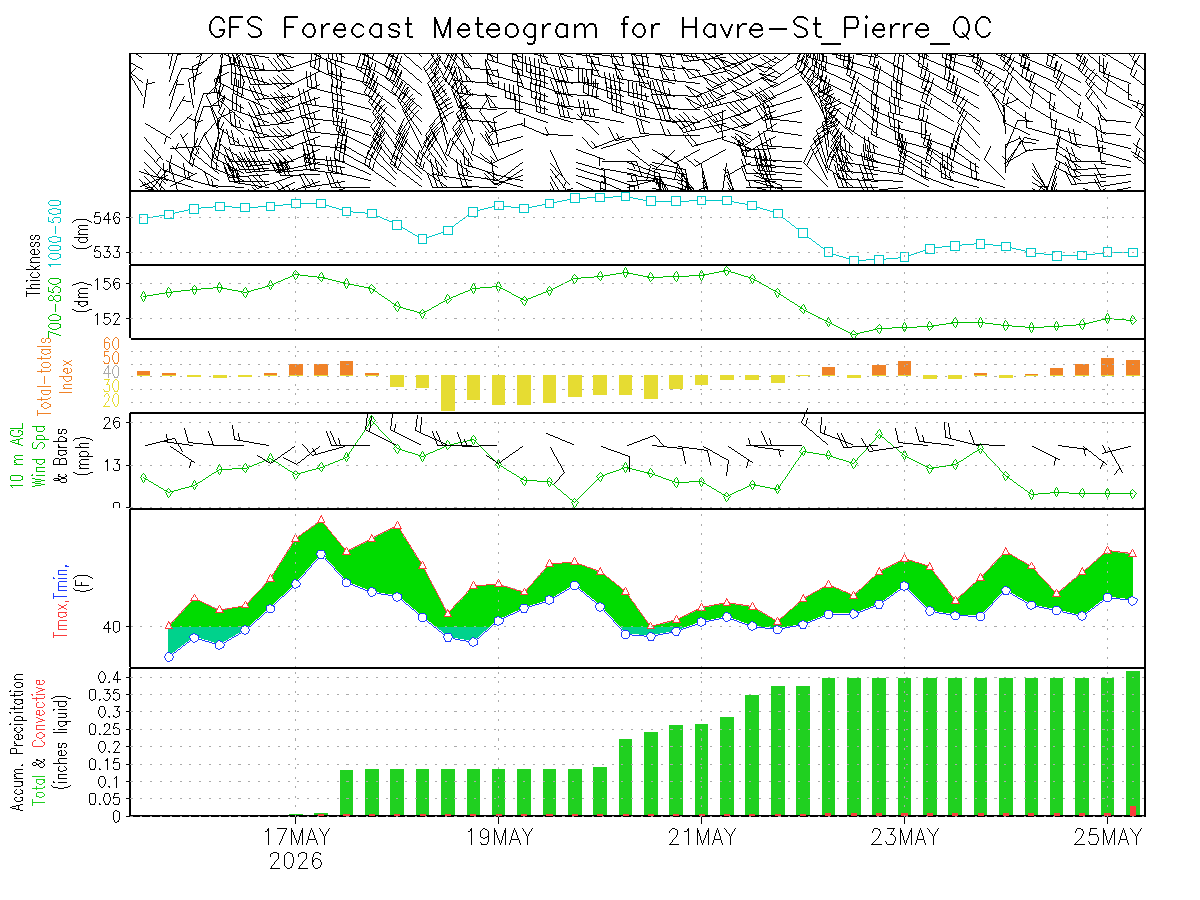
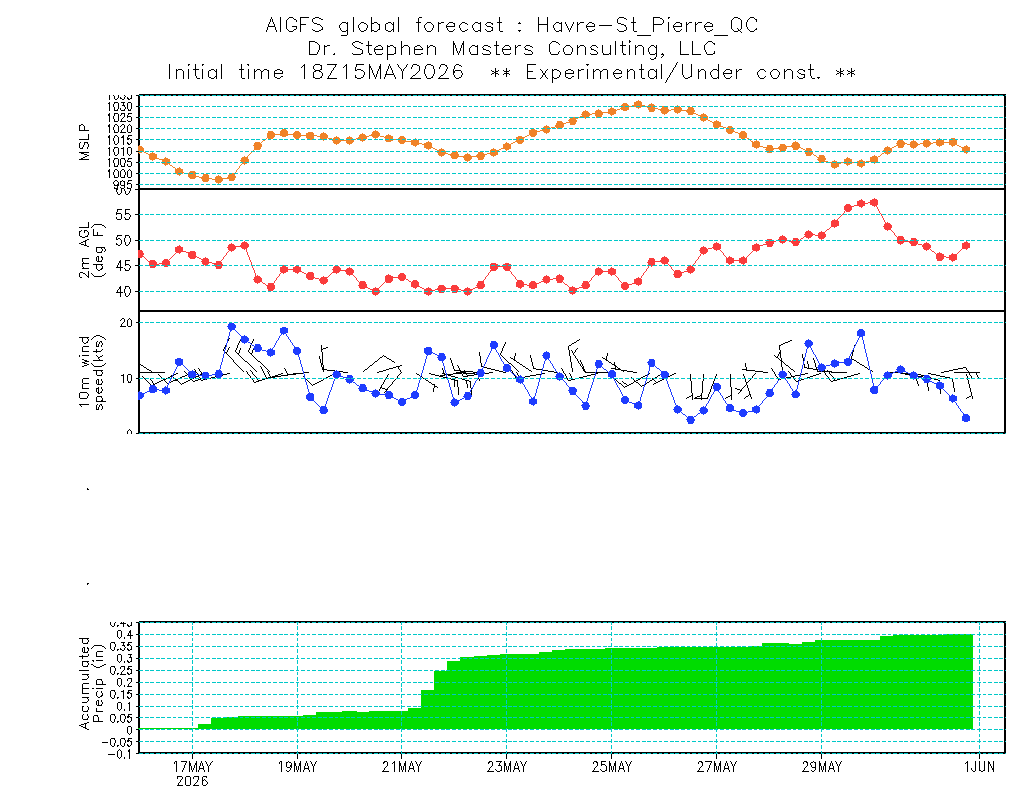
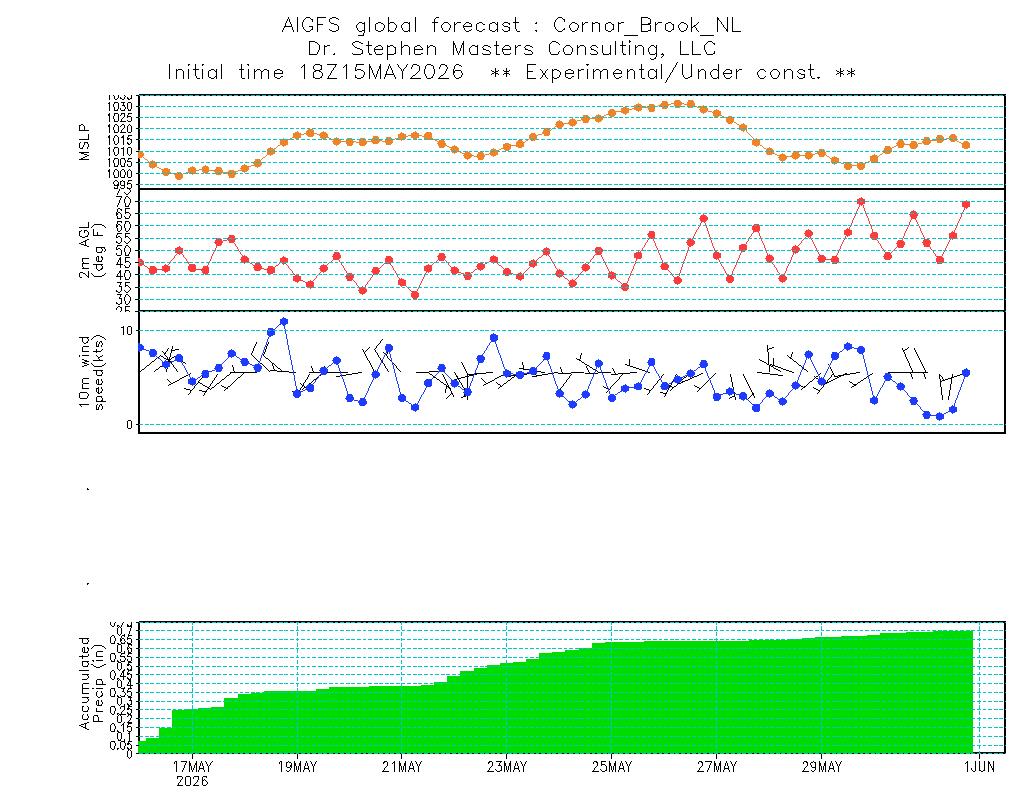
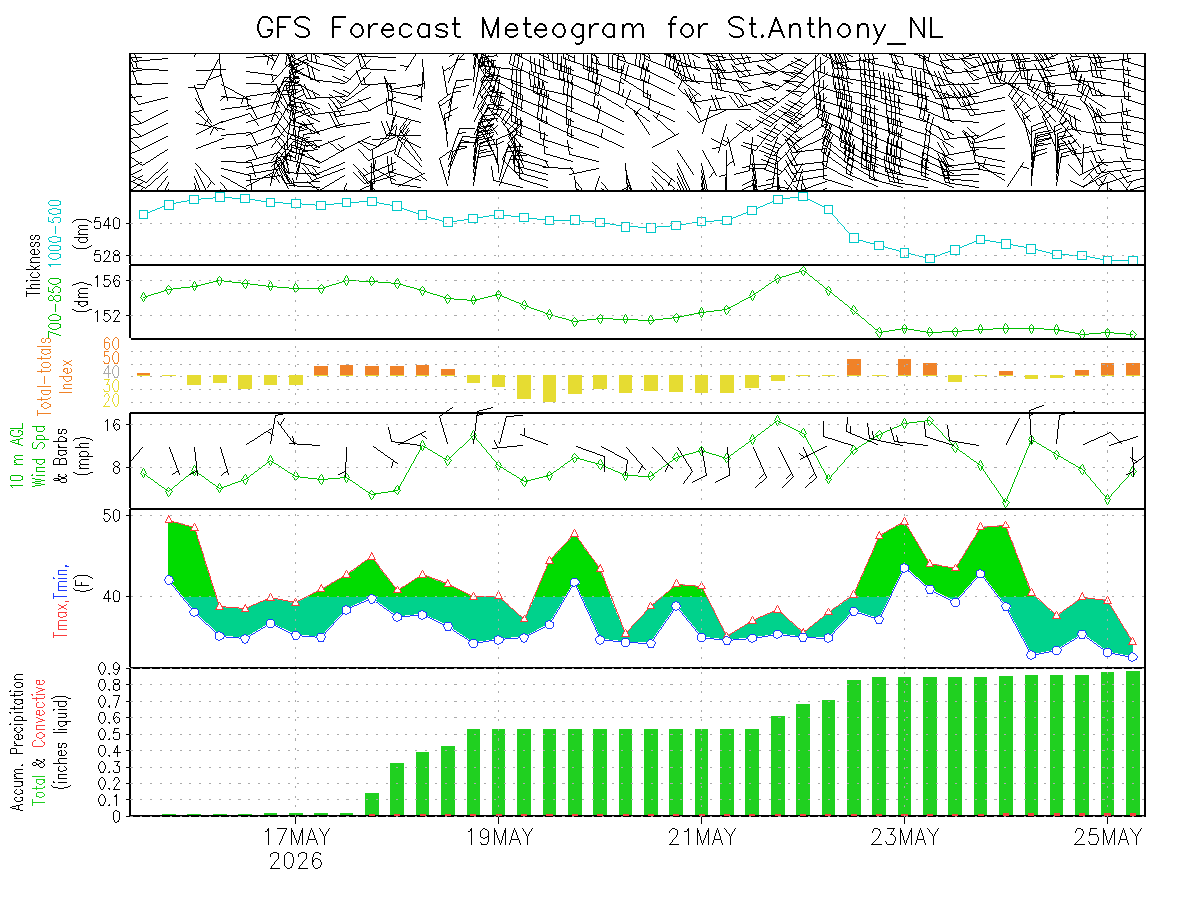
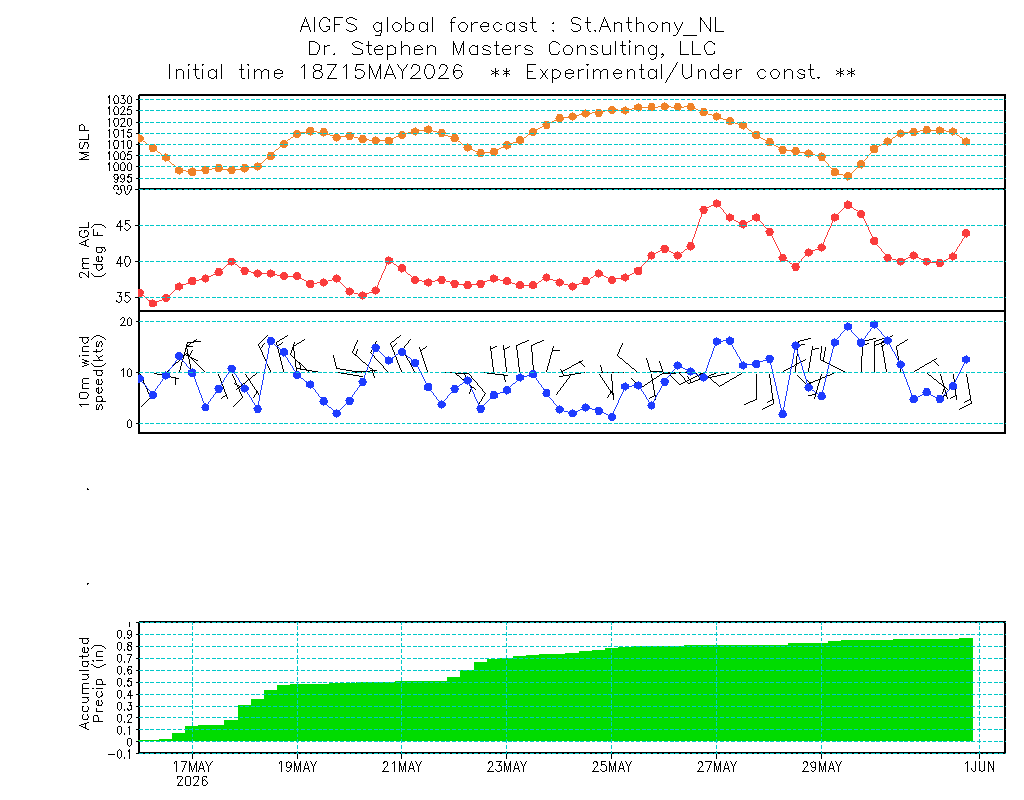
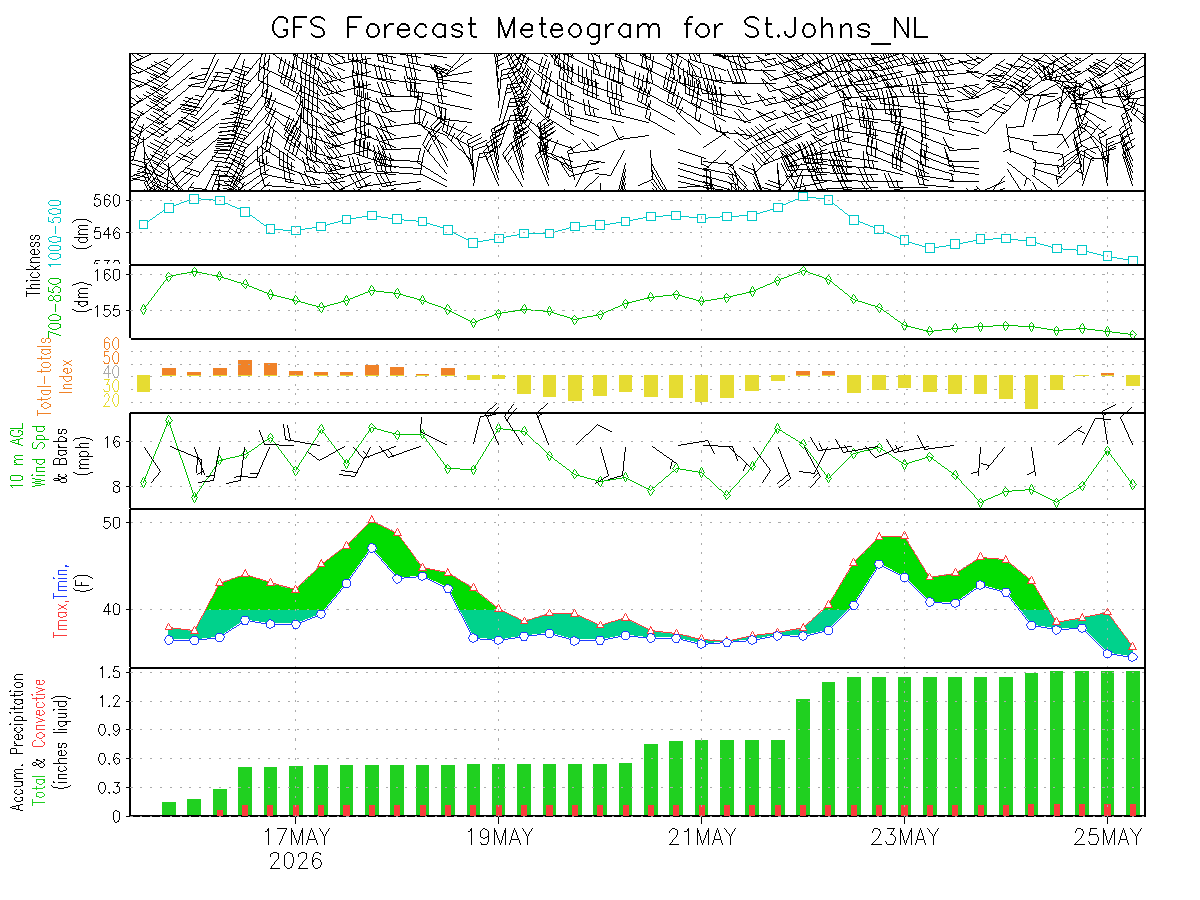
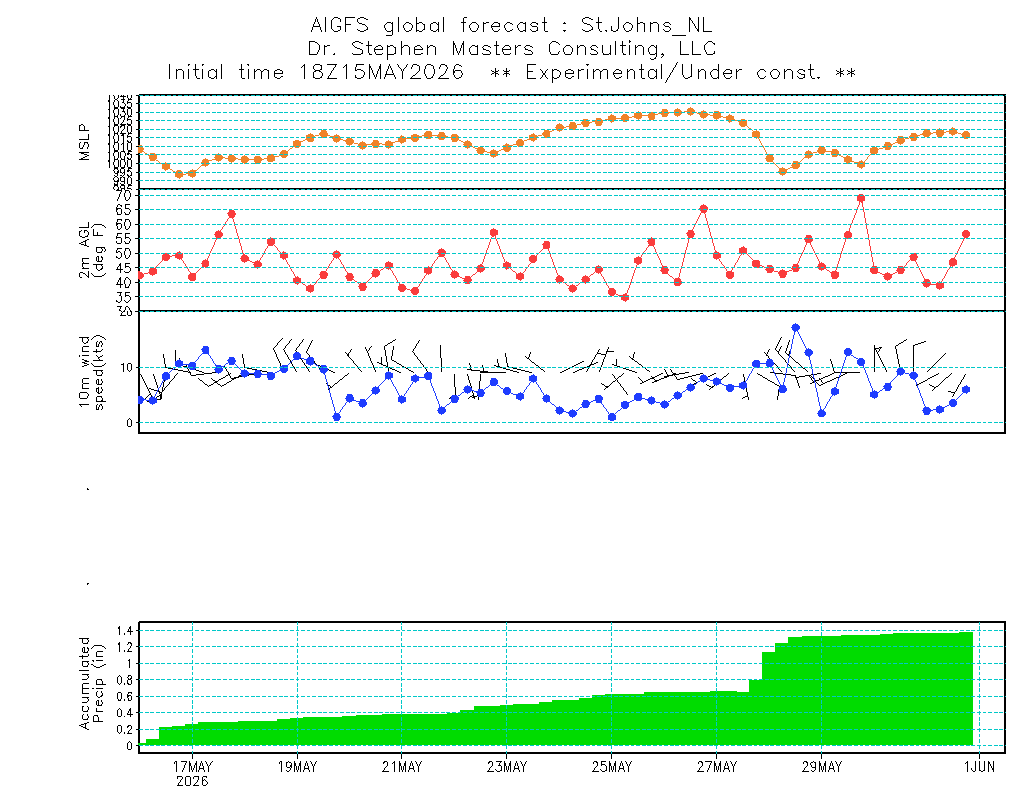
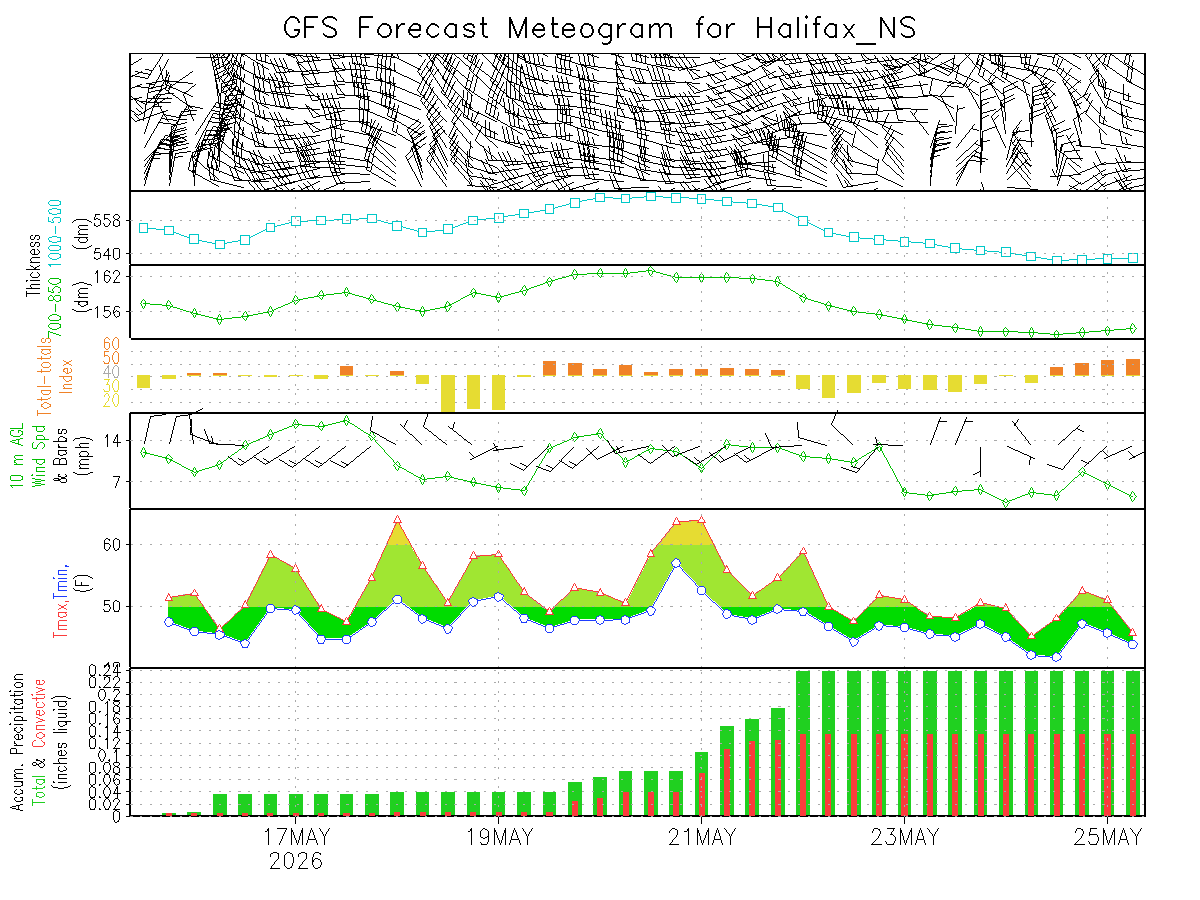
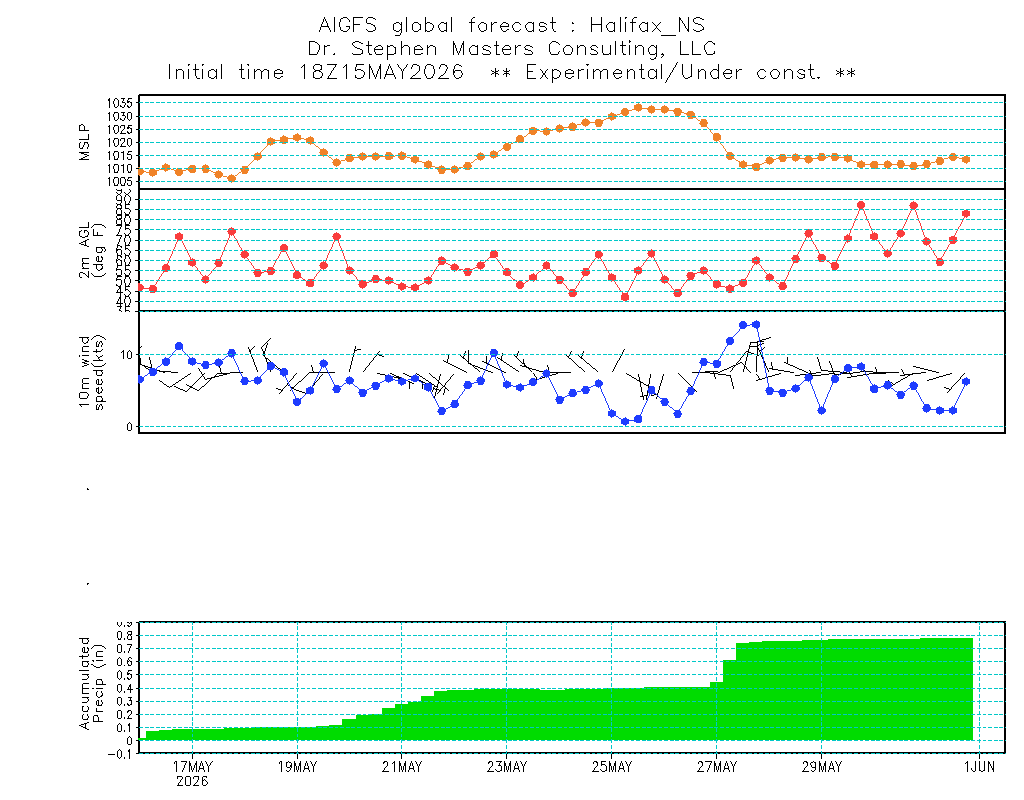
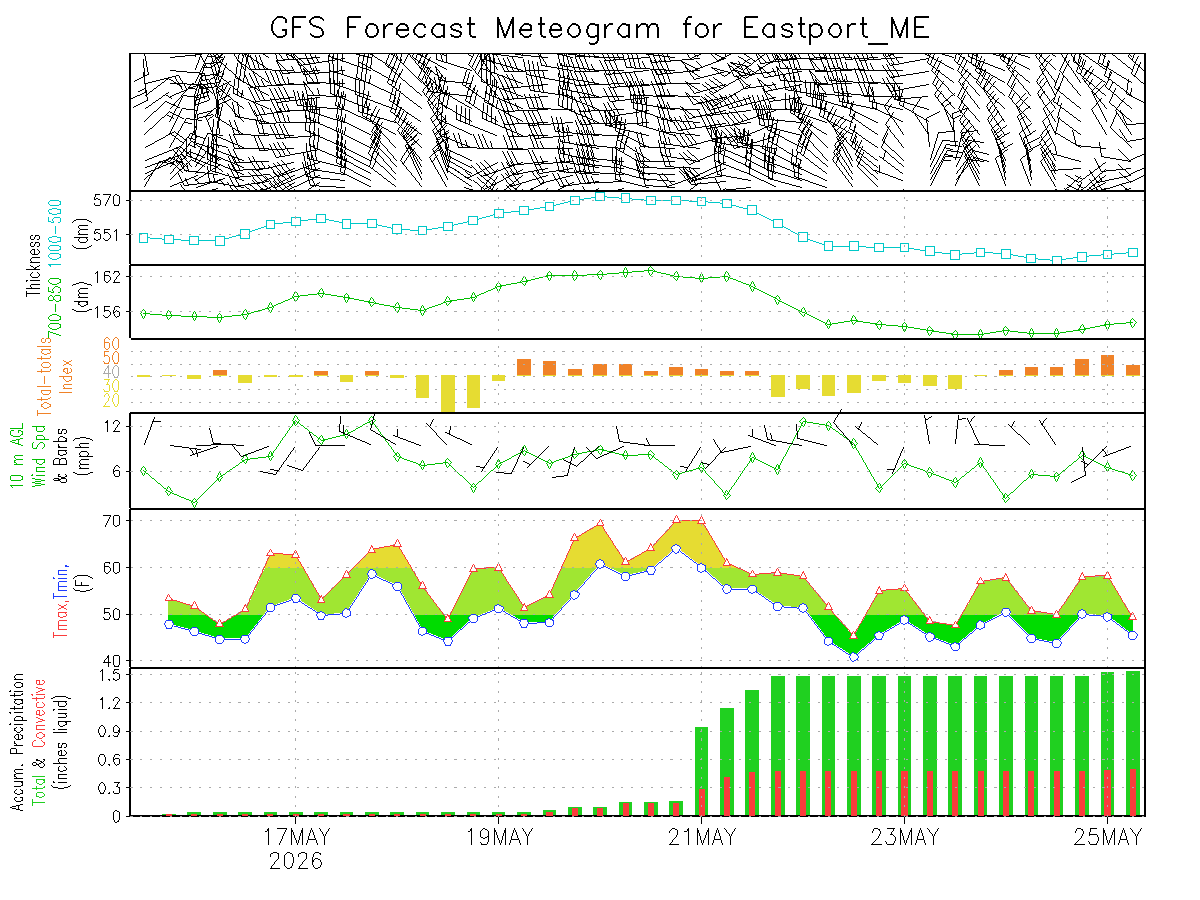
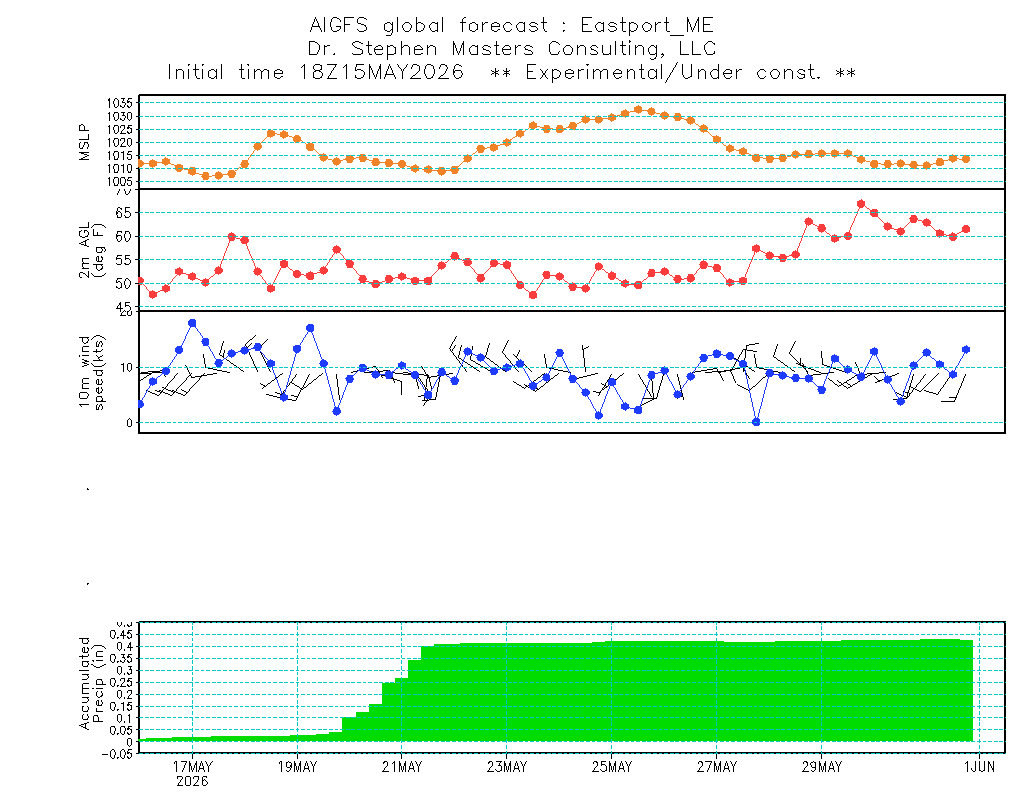
GFS and AIGFS Forecasts
Forecasts from the latest Global Forecast System and the new AI-powered AIGFS run from NCEP.
| North America
| Florida/Atlantic
|
| SLP/Precip
| SLP/Precip
|
| 2m Temp
|
|
| 10m wind
| Sfc winds:
Atlantic
| 500 hPa
| Australia/New Zealand: SLP & precip
|
|
|
|
Melbourne, FL
(AIGFS)
| CCAFS, FL
| |
Montreal, QC
(AIGFS)
| Quebec City, QC
(AIGFS)
|
| Seguenay, QC
(AIGFS)
| Sept-Iles, QC
(AIGFS)
|
| Havre-St. Pierre, QC
(AIGFS)
| Cornor Brook, NL
(AIGFS)
|
| St. Anthony, NL
(AIGFS)
| St. Johns, NL
(AIGFS)
|
| Halifax, NS
(AIGFS)
| Eastport, ME
(AIGFS)
|
| |
Mail to Steve
Dr. Stephen Masters Consulting, LLC home page


